import pandas as pd
import numpy as np
import sklearn
import matplotlib.pyplot as plt
1. Linear Regression
1.1 Simple linear regression
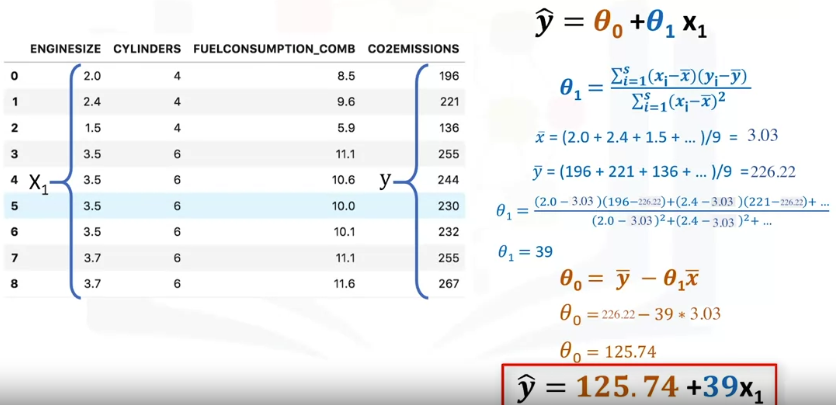
使用数据集 $[X_1, Y]$,训练目标函数 $\hat{y}=\theta_0 + \theta_1x$
1.1.1 Mathematical solution

对上图计算 $\theta_1$ 公式的解释: \(\theta_1 = \frac{\sum(x_i-\bar{x})(y_i-\bar{y})}{\sum(x_i-\bar{x})^2} = \frac{\sum(x_i-\bar{x})[(\theta_0+\theta_1x_i)-(\theta_0+\theta_1\bar{x})]}{\sum(x_i-\bar{x})^2} \\ = \frac{\sum(x_i-\bar{x})^2\theta_1}{\sum(x_i-\bar{x})^2} = \theta_1\)
1.1.2 Python solution (sklearn)
- 分割数据集为 train + test
- 训练模型并预测,再根据预测误差为模型打分(0-1)
from sklearn.model_selection import train_test_split
from sklearn.linear_model import LinearRegression
from sklearn.metrics import r2_score

x_train, x_test, y_train, y_test = train_test_split(x, y, random_state=0)

reg = LinearRegression()
reg.fit(x_train, y_train)

predictions = reg.predict(x_test)
score = r2_score(y_test, predictions)
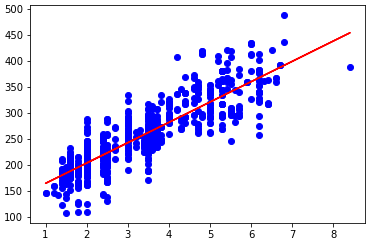
- 绘制数据点 + 表示回归结果的直线
theta0 = reg.intercept_[0]
theta1 = reg.coef_[0][0]

plt.scatter(train_x, train_y_,  color='blue')
plt.plot(train_x, theta0 + theta1*x_train, '-r')

1.2 Multiple linear regression
\[y=X\beta\]where
- $y_{n\times 1}=[y_1, …, y_n]^T$
- $X_{n\times p}=[x_1^T;…;x^T_n]$
- $y_i=\beta_1x_{i1} + … + \beta_px_{ip}$
Python 代码类似 simple linear regression
1.3 Ridge regression
MLE for ridge regression
\[\widehat{\beta}(\lambda)=\arg \min _{\beta}\left\{(X \beta-y)^{T}(X \beta-y)+\lambda\|\beta\|_{2}^{2}\right\}\]1.4 Locally weighted linear regression
\[J(\beta)=\sum_{i=1}^n w_{i}(f(x_i)-y_i)^2\]- $f(x_i)=x_i^T\beta=\widehat{y}_i$ 是我们的预测值
- $w_i$ 是权重,通过点 $x_i$ 与目标预测点 $x$ 的距离来决定,距离越近,权值越大。我们通常使用如下的权重函数: \(w_i=\exp(-\frac{(x-x_i)^2}{2k^2})\)
Matrix version: \(J(\beta)=(X\beta-y)^TW(X\beta-y)\)
- $W=diag(w_1,…,w_n)$
$\epsilon$
2. Non-Linear Regression
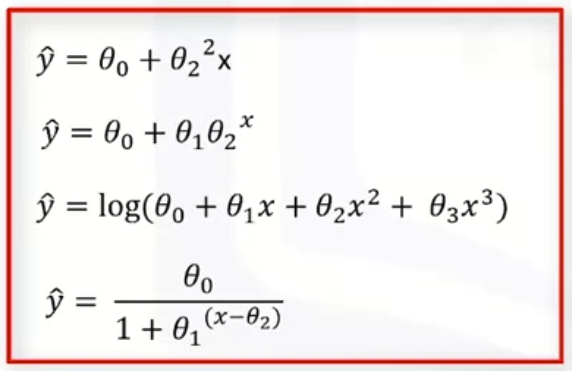
非线形回归的目标函数

2.1 Polynomial regression
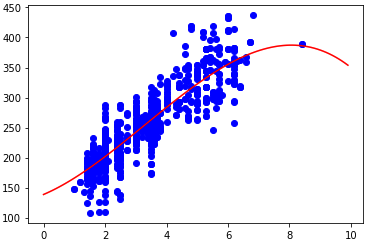
使用数据集 $[X_1, Y]$,训练目标函数 $y=\theta_0 + \theta_1x + \theta_2x^2$
- 分割数据为 train + test
x_train$\to$x_train_poly
from sklearn.preprocessing import PolynomialFeatures
from sklearn.model_selection import train_test_split
from sklearn.linear_model import LinearRegression
from sklearn.metrics import r2_score

x_train, x_test, y_train, y_test = train_test_split(x, y, random_state=0)

poly = PolynomialFeatures(degree=2)
x_train_poly = poly.fit_transform(x_train)
x_test_poly = poly.fit_transform(x_test)
- 训练模型 + 预测 + 打分 + 画图
reg = linear_model.LinearRegression()
reg.fit(x_train_poly, y_train)

predictions = regr.predict(x_test_poly)
score = r2_score(y_test, predictions)

theta_0 = reg.intercept_[0]
theta_1, theta_2 = reg.coef_[0][1], reg.coef_[0][2]

plt.scatter(x_train, y_train,  color='blue')
xs = np.arange(0.0, 10.0, 0.1)
ys = theta_0 + theta_1*xs + theta_2*xs*2
plt.plot(xs, ys, '-r' )

(上图实际为 PolynomialFeartures(degree=3) 时的情况)
2.2 Other non-linear regression
其他形式的非线形回归可以借助 scipy.optimize.curve_fit() 求解,例如该链接内代码拟合了一个 sigmoid 函数: Wiki: Python Scipy #函数拟合
Document Information
- Author: Zeka Lee
- Link: https://zhekaili.github.io/0004/03/02/regression-(non)Linear-Regression/
- Copyright: 自由转载-非商用-非衍生-保持署名(创意共享3.0许可证)