DMAIC: Define, Measure, Analyze, Improve, Control
1. Define
(1) Develop problem and goal statements
Problem Statement
- Requirements: Reccuring, Specific, and Measurable
- Example: the problem stated below is a chronic, reccuring problem, stated in specific and measurable terms
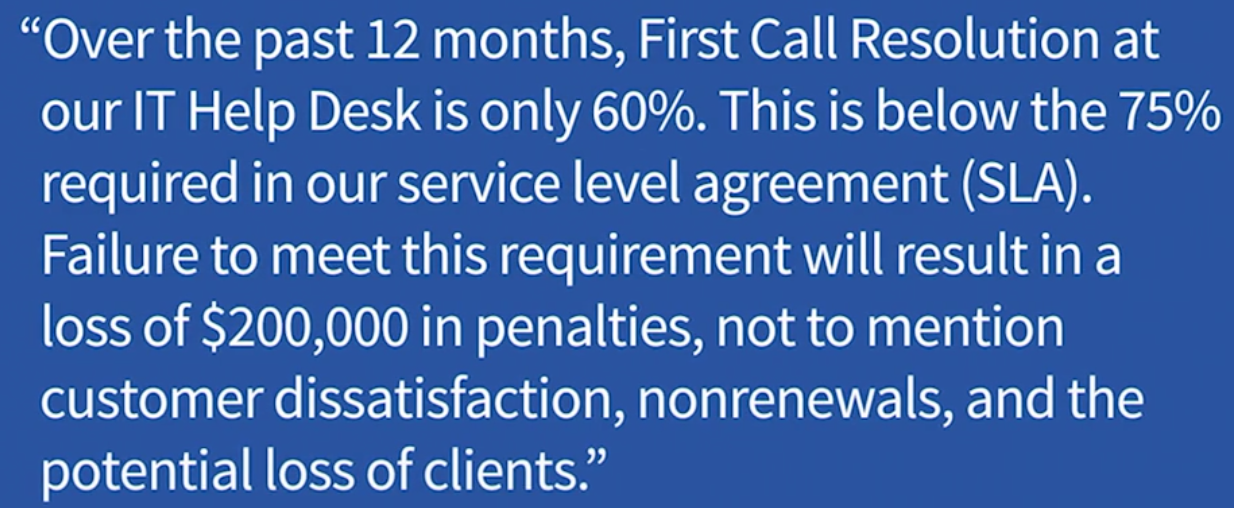
Goal Statement
- Ask ourselves: What measurable perforance outcome must the project accomplish? By when?
- Be SMART:
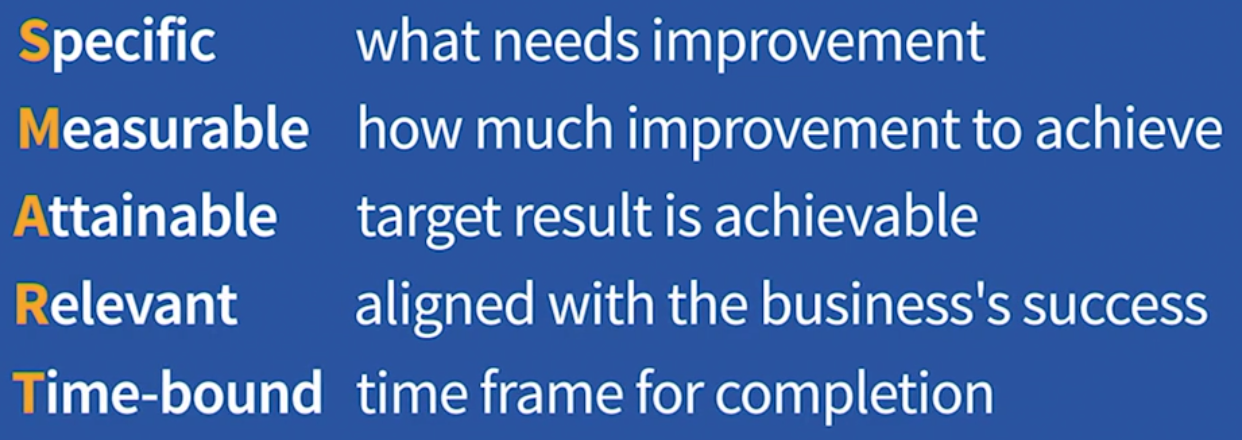
- Example:

We need to define what is the $Y$, the performance measure to improve, in the equation of $Y=f(x)$
(2) Develop project charter
A document providing direction and focus to the team:
- Project name
- Problem and goal statements (based on step one above)
- Key Metric $Y=f(x)$
- Expected benefits (operational and finantial)
- Project scope (project boundary)
- Milestones (check point datas)
- Signatures
- Project leader: agrees to take on project
- Finance: validates expected financial benefits
- Champion: approves launch of the project
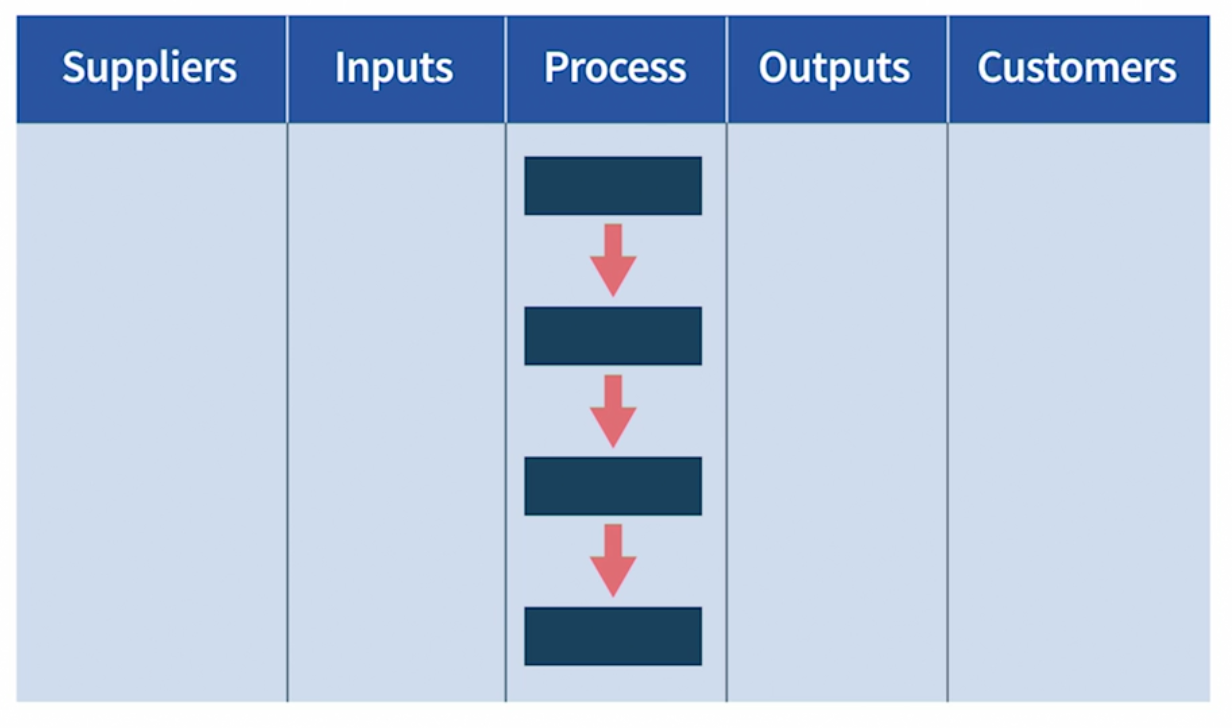
(3) Develop a SIPOC diagram
Purpose is to document and communicate overall scope of processes related to the project on one page
2. Measure
Steps:
- Develop data collection plan
- Map relevant processes
- Validate measurement system
- Measure the $Y$ in $Y=f(X)$
(1) Data collection plan:
- List specific questions regarding $Y$
- Tools needed
- Sources of data
- Type (continuous/discrete) and quantity of data required
Continuous data graphs: 
Discrete data graphs: 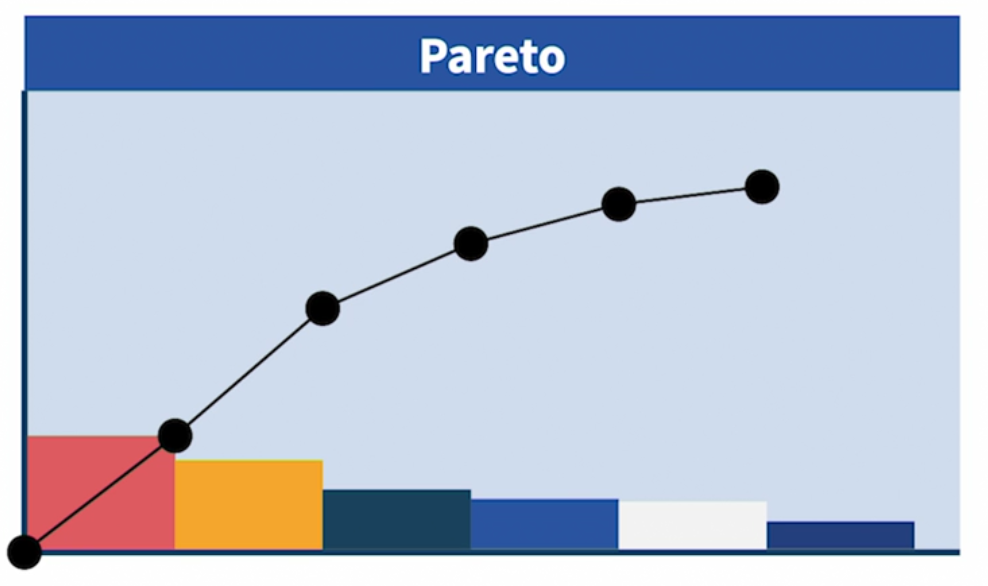
(2) Process Map:
A visual representation of the steps that take place in a process, from start to finish. Ex: Wake-up-and-get-to-work Process 
(3) Validate Data: use Measurement system analysis (MSA)
Requirements of a valid measurement: (using an example of weight scale 体重秤)
- Accurate with no bias: the scale should be calibrated
- Repeatable: if I weigh myself twice in a short time, the results should be same
- Reproducible: my weight in my home should be the same as my weight in my doctor’s office
3. Analyze
Purpose: Determine which $X$(s) impact $Y$ in $Y=f(X)$
Steps:
- List potential $X$(s) that impact $Y$
- Organize potential $X$(s)
- Shortlist and select key $X$(s)
- Develop data collection plan for the analysis
- Prove the key $X$(s) in $Y=f(X)$
(1) List potential $X$(s) that impact $Y$: brainstorm
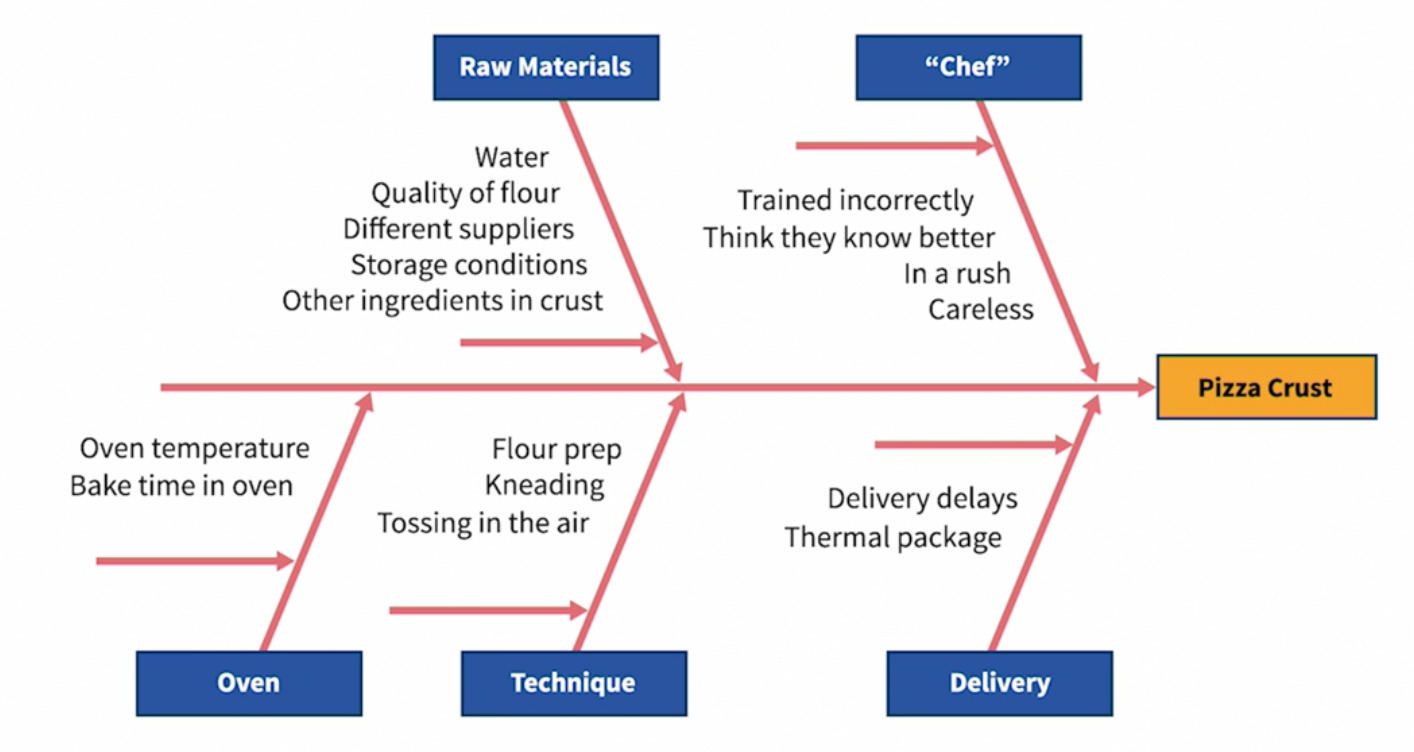
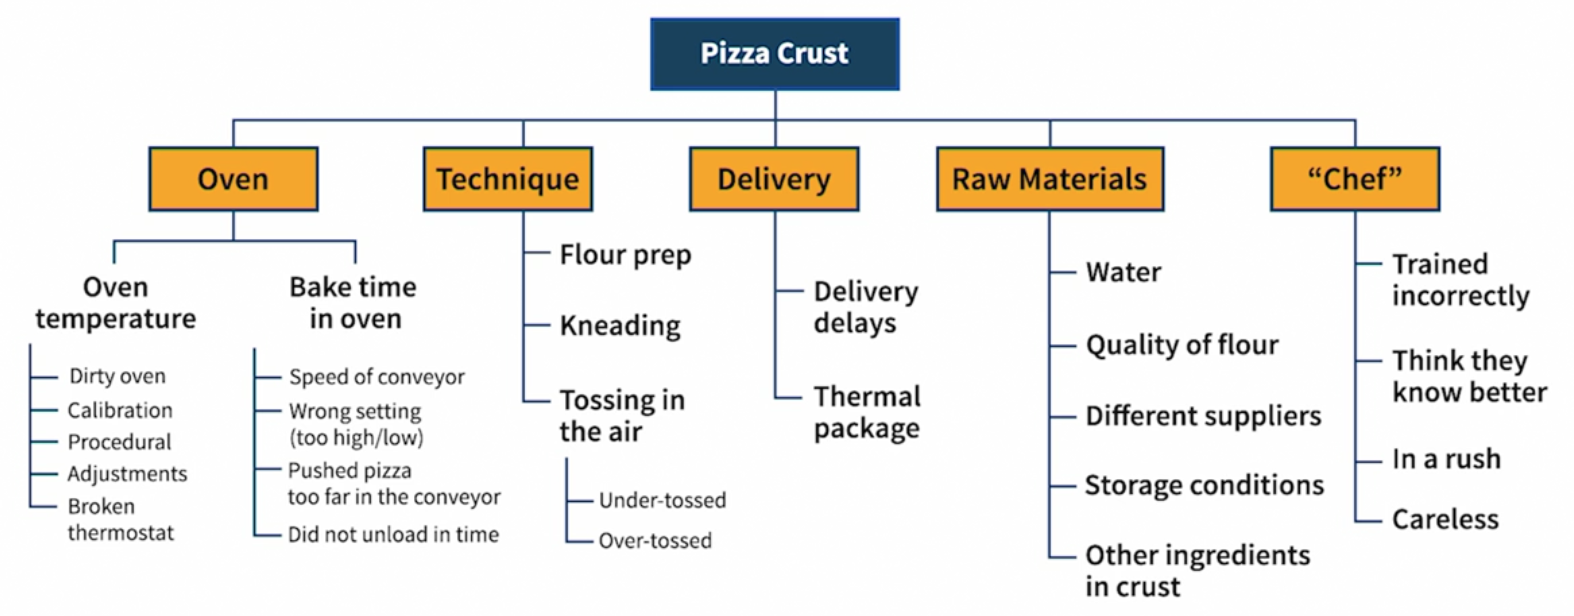
(2) Organize potential $X$(s): use Cause-effect diagram (fishbone)
Ex: CE Diagram for Pizza Crust Problem (饼皮太硬)
- Fishbone:
- Treemap (use Excel):
(3) Shortlist and select key $X$(s): based on the upper diagram
(4) Develop data collection plan for the analysis
- Which hypotheses to test
- What data to collect
- How much data we need
- Collect from whom, when, where
(5) Prove the key $X$(s) in $Y=f(X)$: Validation Process
- Inferential statistics
- Hypothesis test
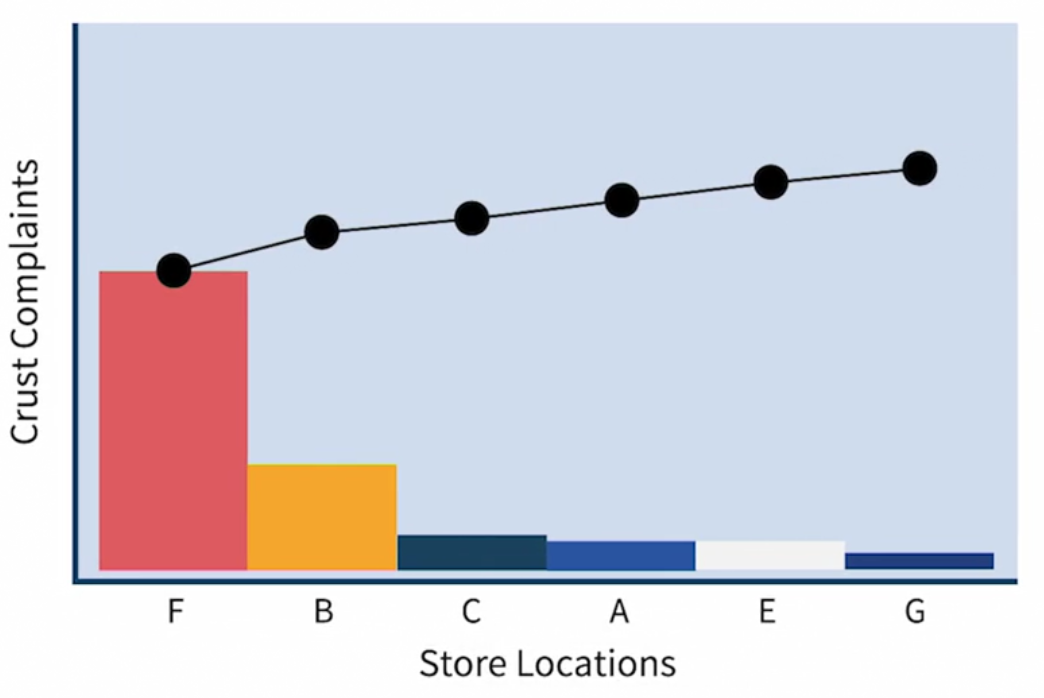
Ex: Analyze and validate throught graphs and charts, using Pizza Crust Problem (饼皮太硬问题). To validate two potential $X$
- $X_1$: one or two resteraunt at fault
- $X_2$: Variation in oven temperatures
$X_1$ is proved using Pareto Chart for Crust Complaints by Store Location
$X_2$ is proved using Dotplot and Boxplot for Temp Variation by Chef

4. Improve
Purpose: Address proven key $X$(s) and find solutions (best combination of key $X$(s)) to improve $Y$
Steps:
- Potential solutions for proven key $X$(s)
- Solution alternatives
- Right set of solutions to implement
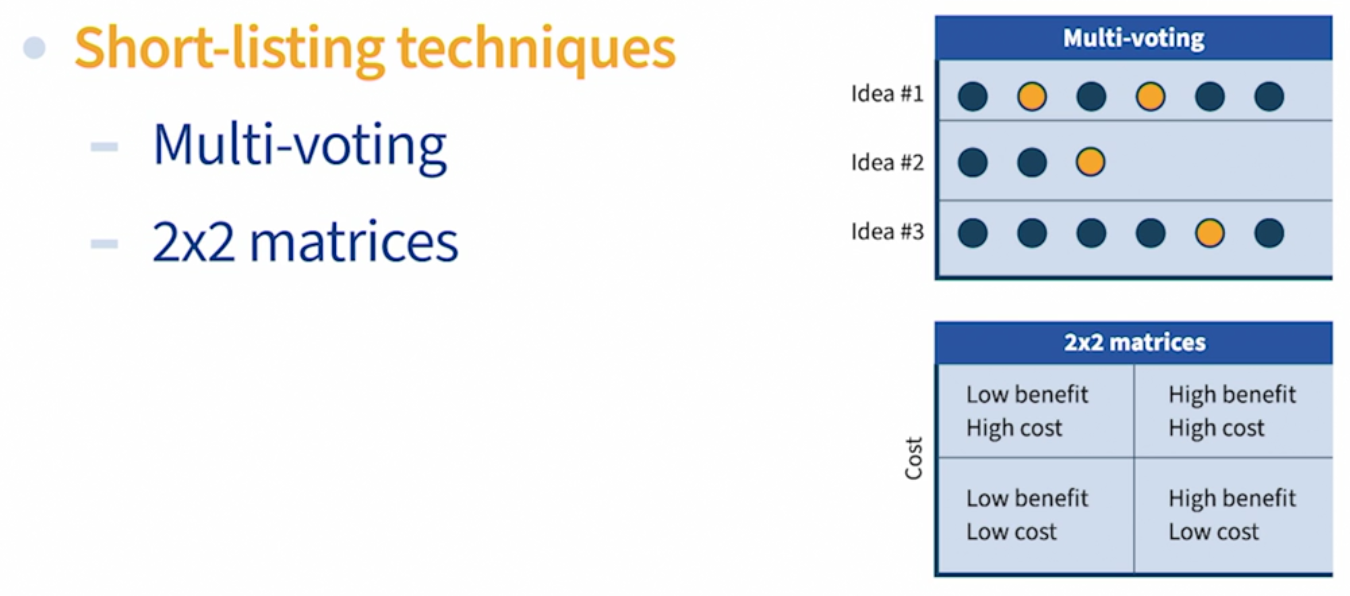
Generate, evaluate, and select solutions
Evaluate solutions:
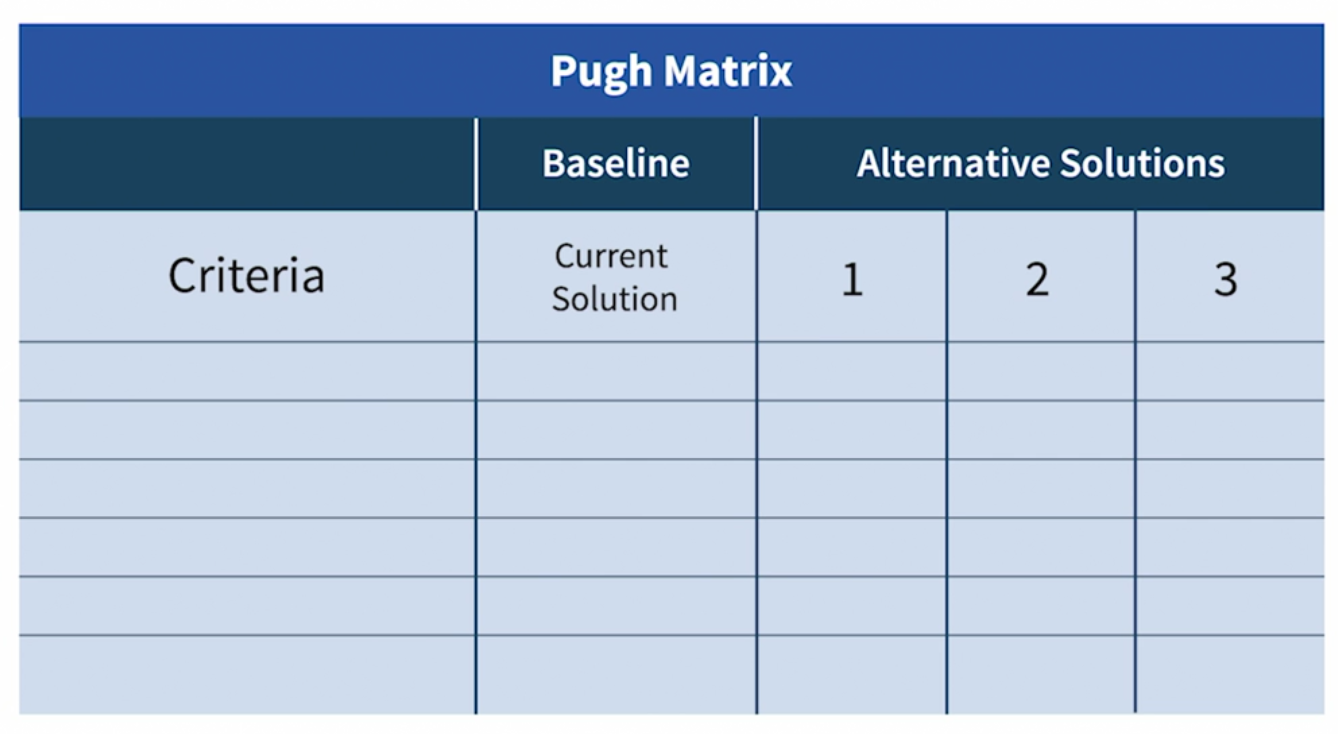
Select solutions: Pugh Matrix (Criteria selection matrix)
Reduce the risk of failure through FMEA
FMEA (Failure Modes and Effect Analysis) is a tool to help anticipate and mitigate risk of failure.
Order failure modes by Risk Priority Number (RPN):
\[RPN=\text{Severity}\times\text{Occurrence}\times\text{Detection}\]- $\text{Severity}$: What’s the effect? How severe is it (1-10)?
- $\text{Occurrence}$: What are potential causes? How likely is the occurrence of potential causes (1-10)?
- $\text{Detection}$: What process controls are in place to detect cause or failure mode? What’s the likelihood of detection (1-10)?
Mistake proofing (防范错误)
Adding mistake proofing to projects will be helpful. Three levels of mistake proofing:
- Prevention
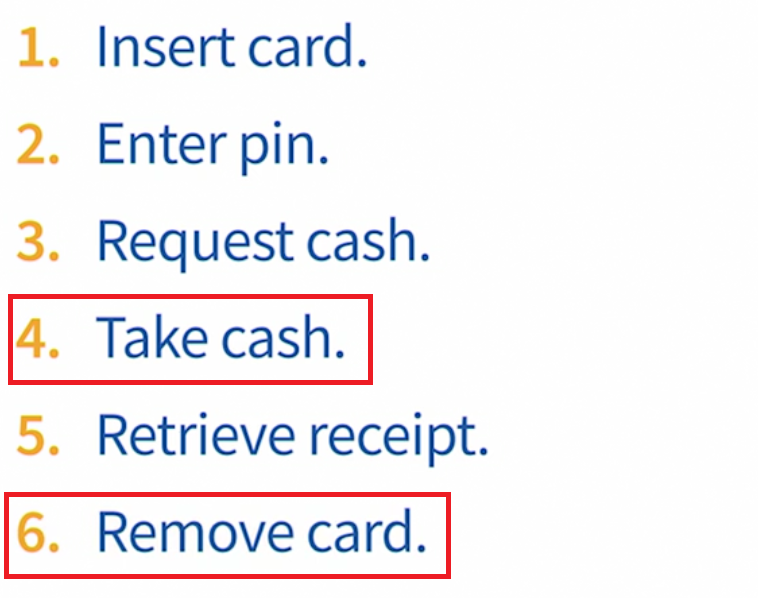
- Ex: Change the operation sequence of ATM to prevent forgeting to remove card after taking cash
- Swap steps 4 and 6, that is, can only take cash after removing card
- Facilitation: if prevention is not applicable
- Ex: To avoid the cashier typing an inccorect price, try to scan Bar Code instead
- Detection:
- Ex: Spelling error detection in Word
5. Control phase:
Purpose: Control of key $X$ factors to ensure improved $Y$ is sustainable
Steps:
- Develop plan (Monitor, control, regulate performance)
- Work with owners to update procedures
- Implement and monitor performance
- Validate financial impact
- Secure project completion sign-off
Control Plan
Control plan is the blueprint to ensure the right controls are implemented to achieve sustainable targets:
- Control subject: what needs to be controlled
- Ex: oven temperature
- Specification, target, or desired range
- Ex: target 22C, hot more than 24C, cold less than 19C
- How feedback is provided
- When and what action to take
- Ex: when temp above 25, turn off AC; when below 15, turn off AC, or turn on heat if needed
- Who is authorized to monitor and take action?


Document Information
- Author: Zeka Lee
- Link: https://zhekaili.github.io/0007/09/02/Six-Sigma-DMAIC/
- Copyright: 自由转载-非商用-非衍生-保持署名(创意共享3.0许可证)