1. Define
1.1 High level metric: customer funnel

1.2 Expand on the funnel
The layers in the funnel above are too generall, we need to make them more detailed:
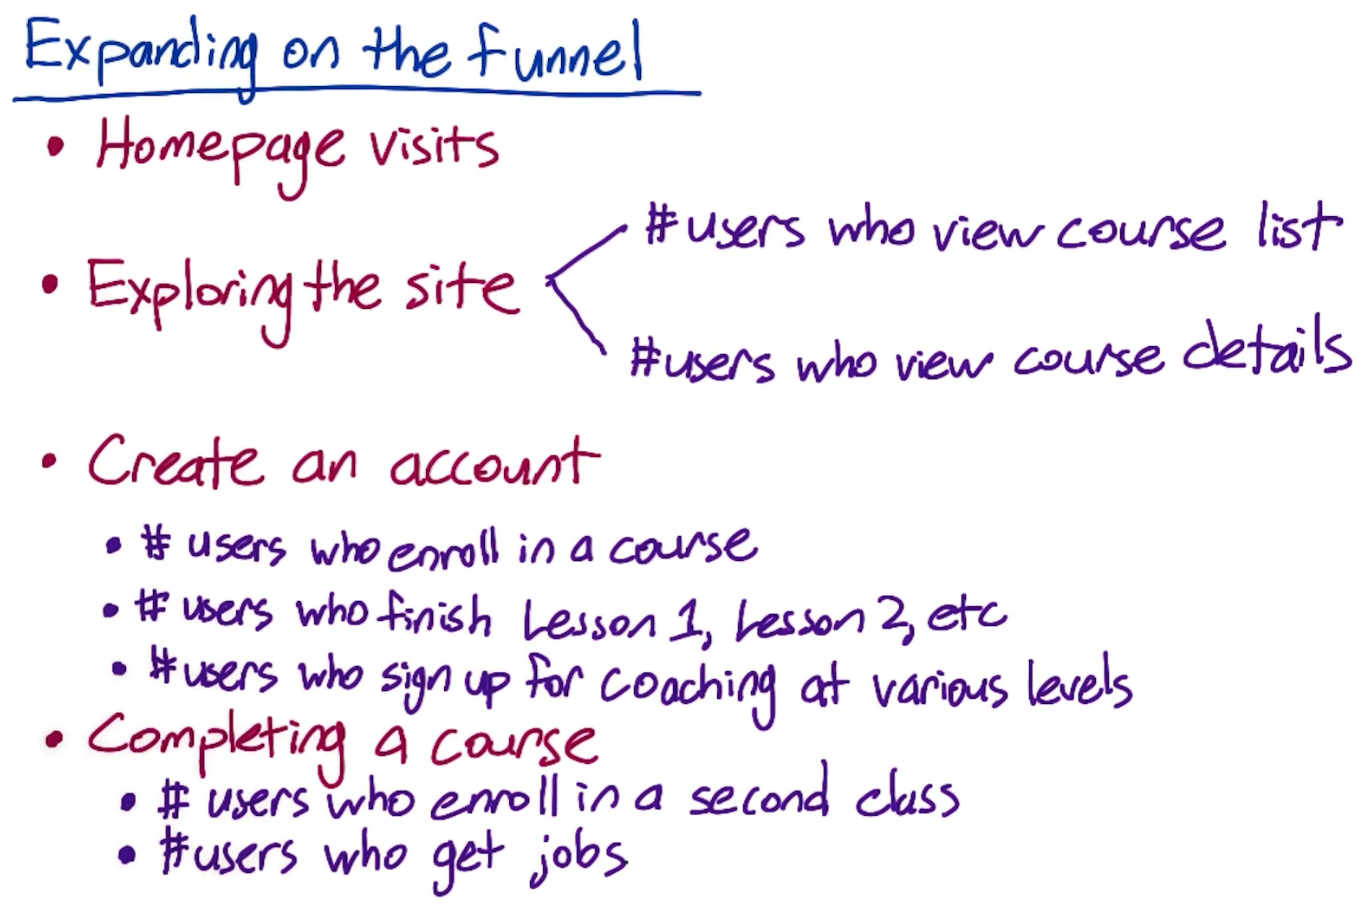
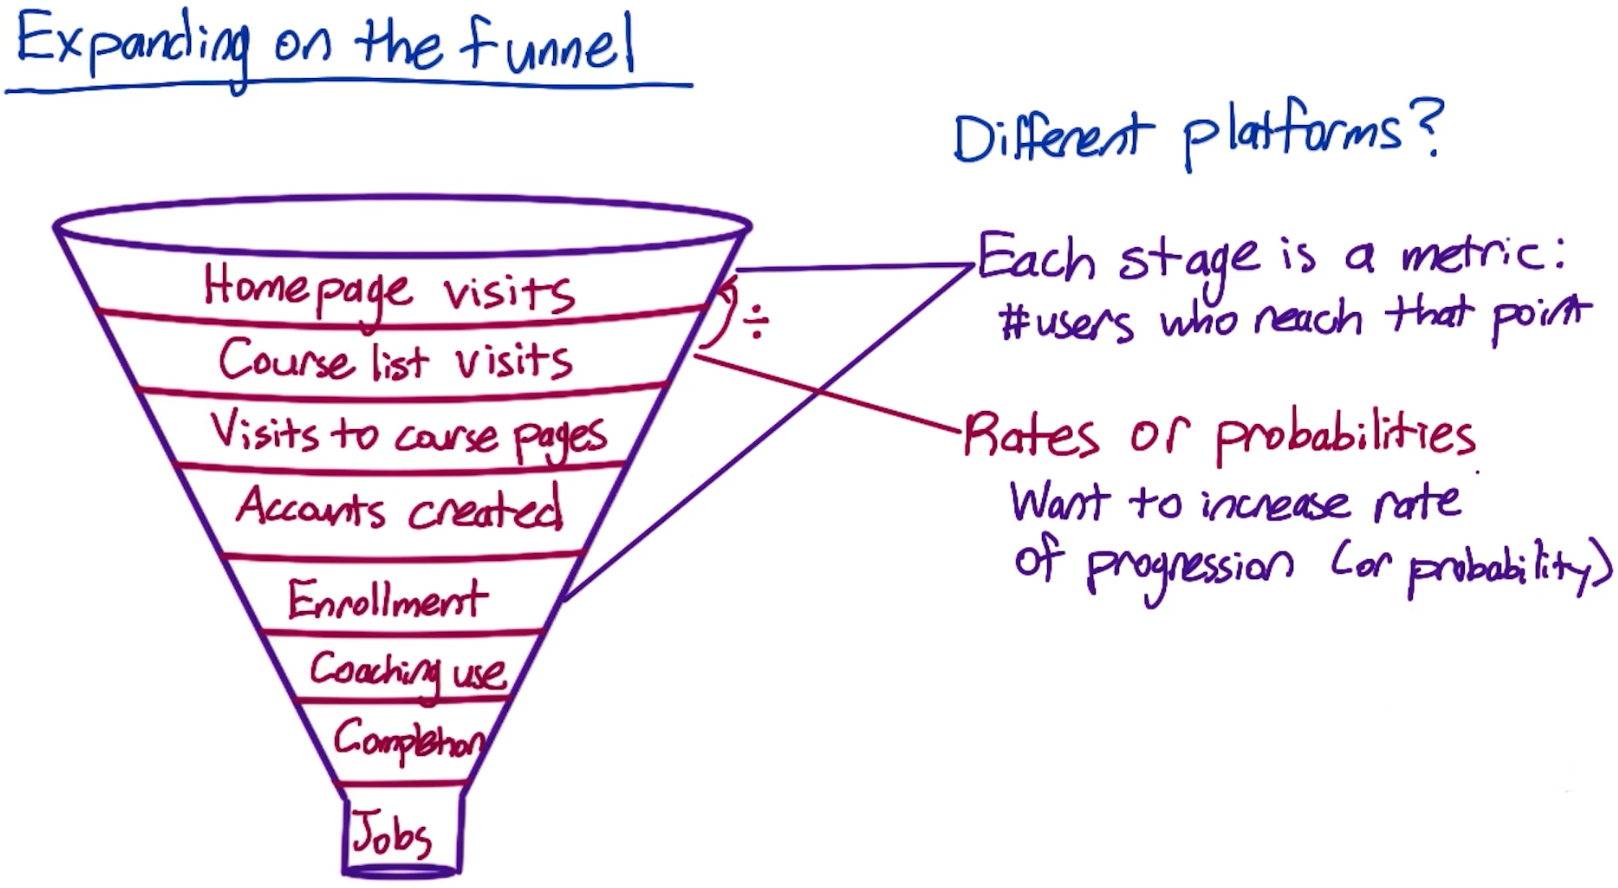
After expending, we could try to find some metrics directly from funnel:
- The number of each stage could be metric. But in general, we only need to choose some more meaningful layers, such as #homepage visits, and #enrollment
- Rates or probabilities, which is division of two stages
1.3 Choose Metrics
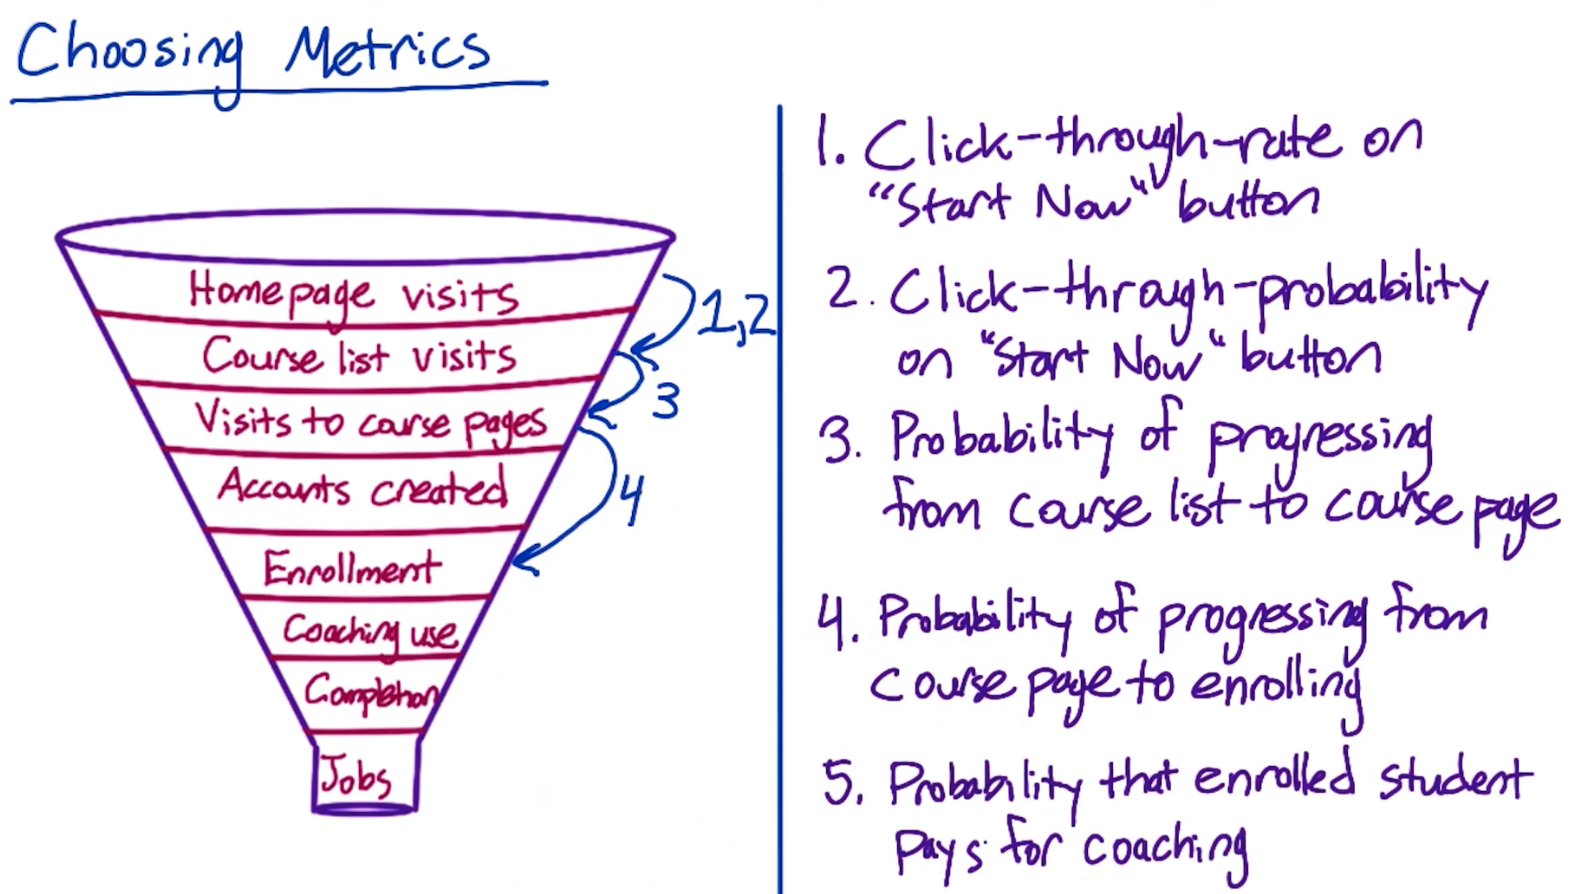
For different experiments, we have to choose different metrics (one or more):
- Update a description on the course list page Metric 3: Probability of progressing from course list to course page
- Increase size of “Start Now” button Metric 1: Click-through-rate on "Start Now" Button
- Explain benefits of paid service Metric 5: Probability that enrolled student pays for coaching (in funnel, it’s equal to #coaching use / #enrollments)
1.4 Difficult Metrics
Reasons for difficult metrics
- Don’t have access to data
- Takes too long time
Examples:
- Rate of returning for 2nd course = (#who start 2nd)/(#who complete 1st) have data, but too long time (maybe months between taking two course)
- Average happiness of shoppers no data
- Probability of finding information via search no data
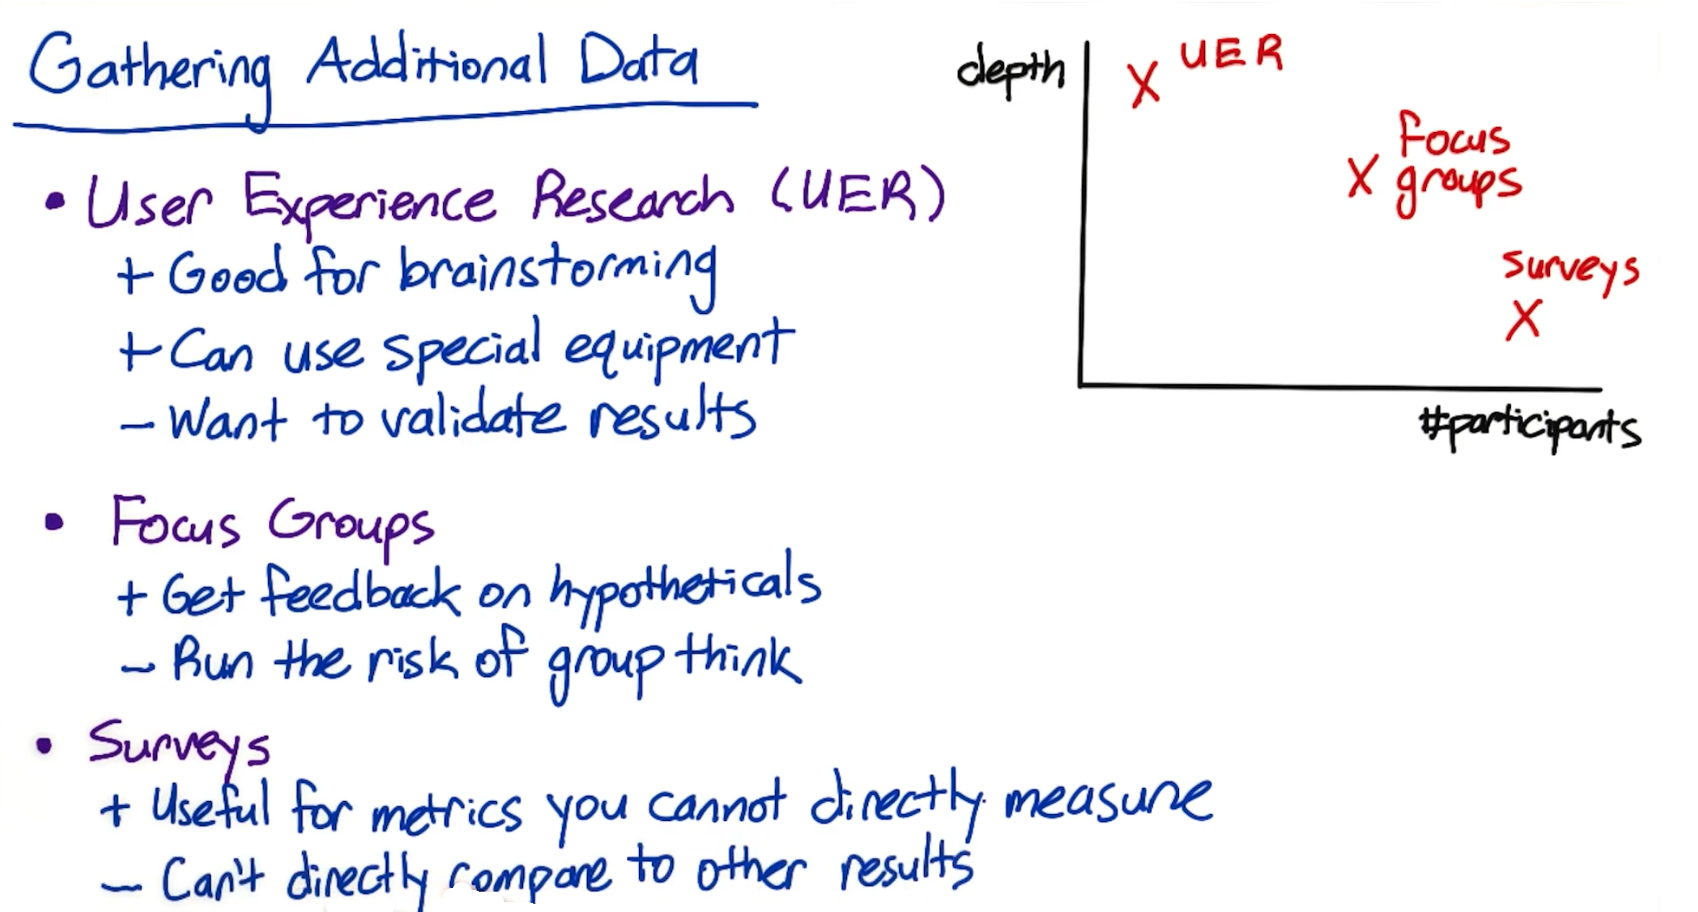
1.5 Other Techs to Define Metris
- (1) External Data Use external data for comparsion
- (2) User Experience Research (UER) low participants, deep depth
- (3) Focus Groups (like group discussion) medium participants, medium depth
- (4) Surveys high participants, shallow depth
- (5) Retrospective Analysis 回顾分析 A retrospective analysis or retrospective study is a research method that is used when the outcome of an event is already known. For example, medical researchers might study the records of patients who suffered from a particular disease to determine what factors may have led to their illness or death.
- (6) Experiments
1.5.1 Apply other techs
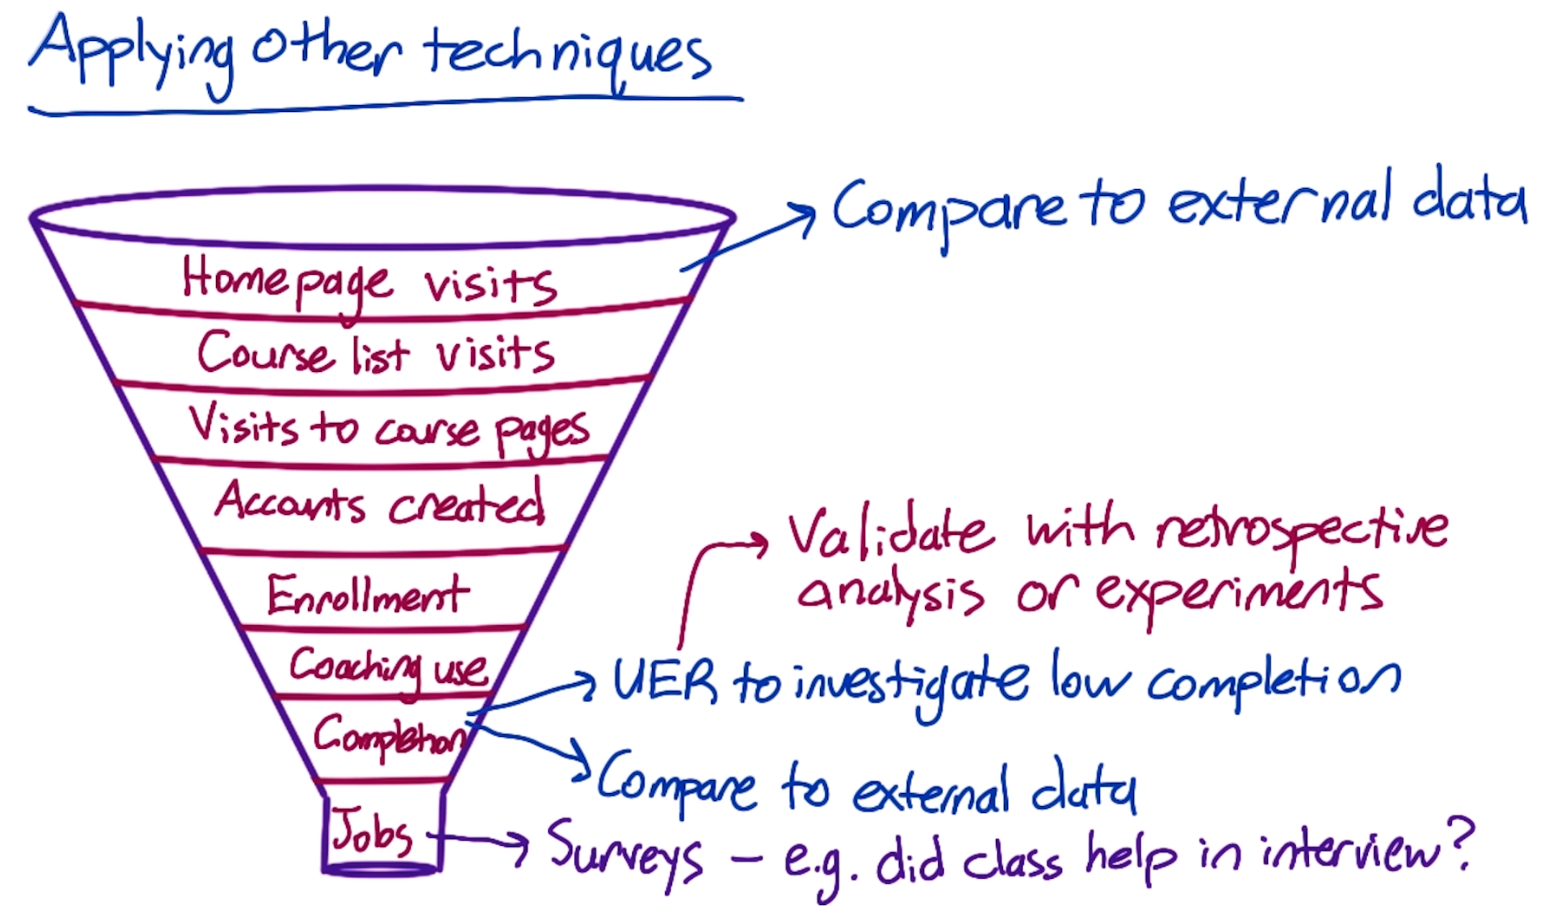
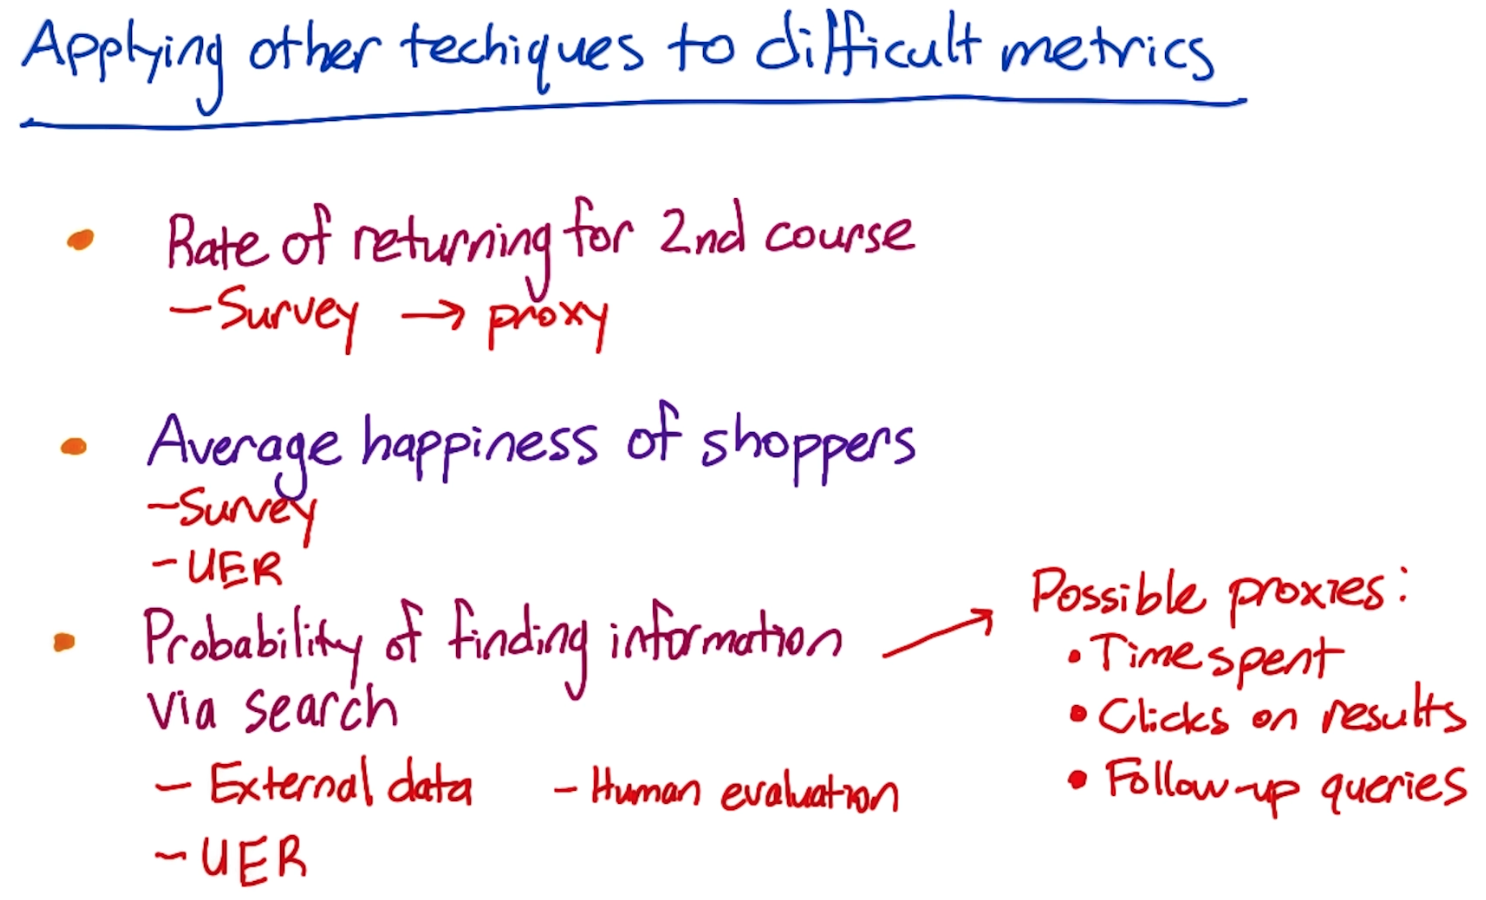
2. Build Intuition
2.1 Define Metrics
Define metrics is to turn a high-level metric to a well-defined metric</font>
In previous example, we use Click-through-probability as the high-level metric: \(\text{click-through-probability}=\frac{\#\text{users who click}}{\#\text{users who visit}}\)
How to identify user? Cookies or Pageviews
2.1.1 Three well-defined metrics
Def #1: Use cookies, calculate \(\frac{\#\text{cookies that click}}{\#\text{cookies in <time interval>}}\)
For example, for one cookie:
- per minute: $2/3$, there are 3 valid minutes, two of them have click event

- per hour: $1/2$, there are 2 valid hours, one of them has click event

- per day: $1$
Def #2: Use pageviews, calculate \(\frac{\#\text{pageviews result2 click within <time interval>}}{\#\text{pageviews}}\)
For example: 
use Def #1 in minite, we get $1/1$; use Def #2 in minute, we get $1/2$
Def #3: click-through-rate \(\frac{\#\text{clicks}}{\#\text{pageviews}}\)
2.1.2 Problems of three metrics
Problem 1: double click: def #3, click-through-rate will be greatly influcence (用户频繁随意双击)
Problem 2: back button cashes page (通过返回键返回的界面一般是已经缓存了,不会二次刷新,因此就不会被当作 new pageview,但其实应该算) def #2 & #3 will be influenced because they are related to the number of pageviews
2.2 Summerize Metrics
There are different ways to summerize metrics:
- (1) Sum and counts e.g. #users who visited page
- (2) Means, medians, and percentiles e.g. mean age of users who complete a course, median latency of page load
- (3) Probability and rates probability 0 or 1 rates: 0 or more
- (4) Ratio ratio = probability A / probability B e.g. P(revenue-generating click) / P(any click)
So how to choose among them? Let’s take choosing among mean, median and percentiles as an example: the following picture shows a histogram of video loading latency 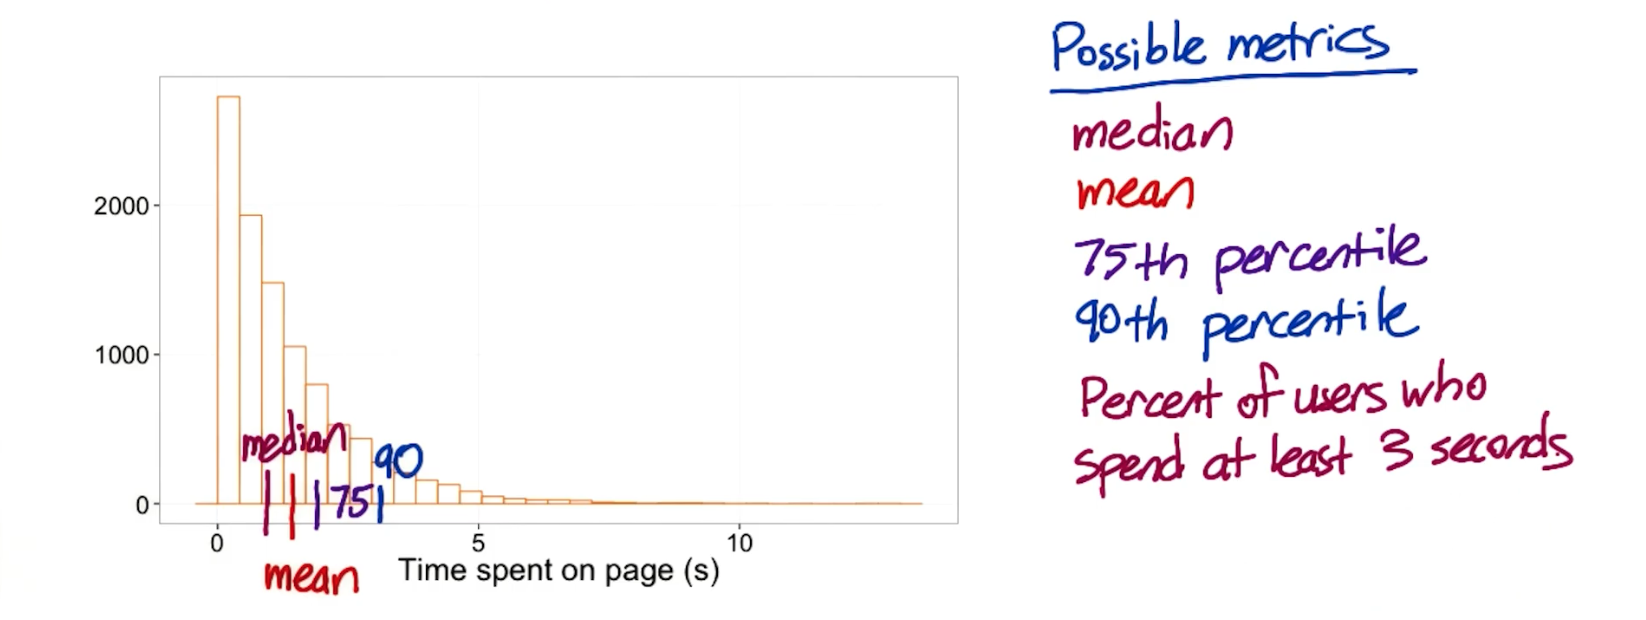
Which metric? Analyze in two fields: Robustness and Sensitivity
2.2.1 Robustness (A/A Testing)
Choose 5 videos with similar latency distribution: 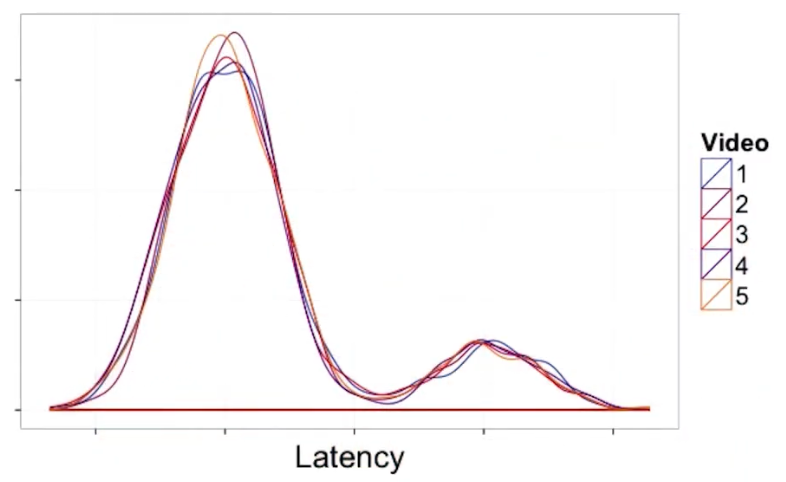
Then apply 5 different metrics on these 5 videos: 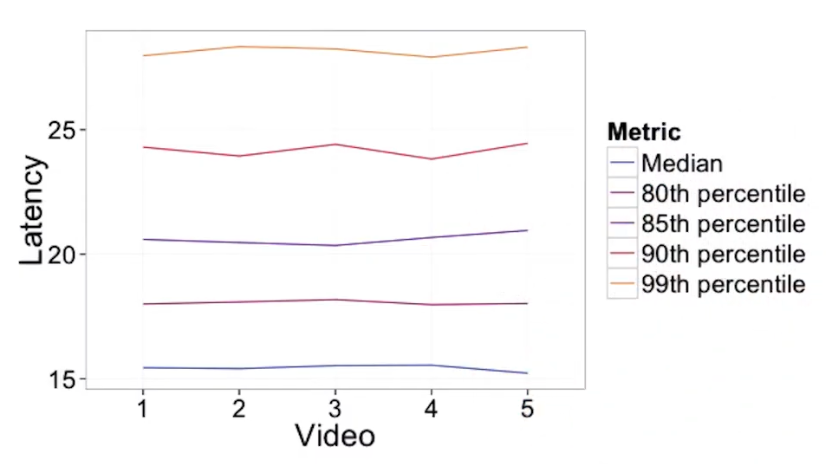
Since these 5 videos are similar, according to robustness, it’s expected that the value of their applied metrics should also similar. However, in the above chart, 99th and 90th percentile occillate too much, not robust enough
Robustness test is also called A/A testing. Because compared to A/B testing, we chane nothing in robustness test.
2.2.2 Sensitivity
Choose the same video with 5 different resolutions, (1 to 5 from highest resolution to lowest). 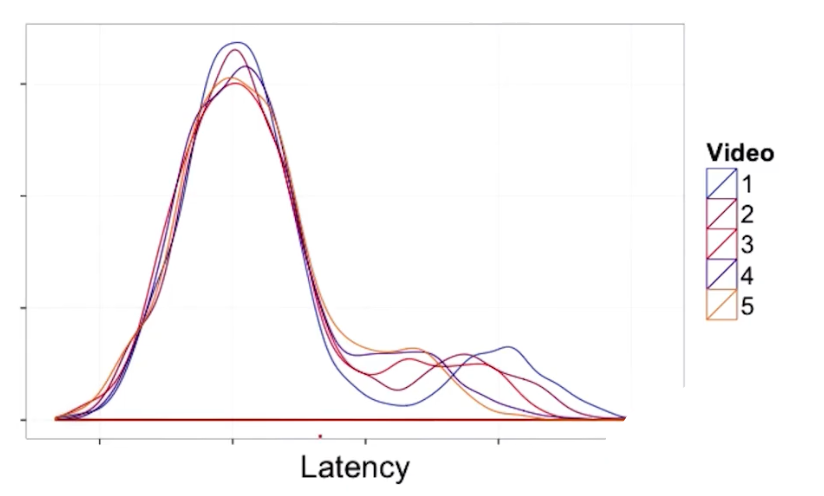
Then apply 5 different metrics on these 5 resolutions: 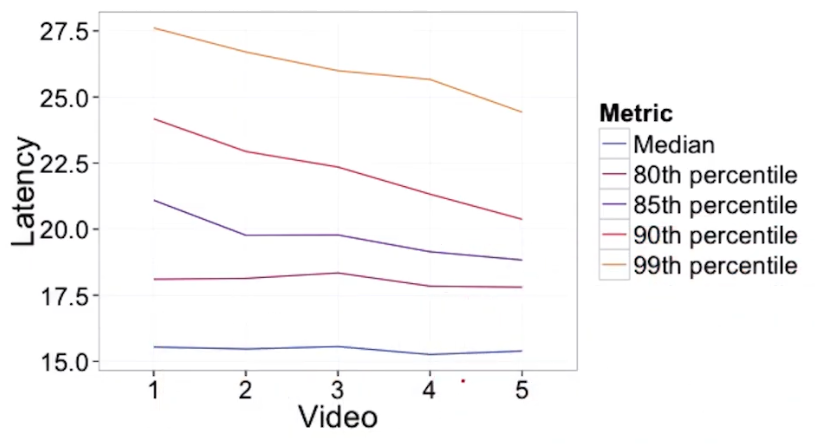
Since resolutions from high to low, according to sensitivity, it’s expected that the value of latency should have obvious decrease. However, in the above chart, Median and 80th percentile don’t decrease, not sensitive enough
3. Characterize
3.1 Variability
To calculate a confidence interval, you need:
- Standard Error (Standard deviation of samples’ mean)
- Distribution
For example, for binomial, we have
- $SE=\sqrt{\hat{p}(1-\hat{p})/N}$
- $m = z^*\times SE=1.96\times SE$
| type of metric | distribution | estimated variance |
|---|---|---|
| probability | binomial (normal) | $\frac{\hat{p}(1-\hat{p})}{N}$ |
| mean | normal | $\frac{\hat\sigma^2}{N}$ |
| median/percentile | depends cuz they will be non-normal if data is non-normal | depends |
| count/difference | normal (maybe) | $Var(X)+Var(Y)$ |
| rates | poisson | $\bar{x}$ |
| ratios | depends | depends |
Example: Confidence interval for a mean $X = [87029, 113407, 84843, 104994, 99327, 92052, 60684]$ then
- $\bar x=\text{sum}(X)/7$
- $\sigma =\text{std}(X)$
- $SE=\sigma/7$
- $I=[\bar x-1.96SE,\bar x+1.96SE]$
3.2 Empirical Variablility (Nonparametric)
对于一些比较复杂(分布很抽象),使用 empirical viaraiblity 的好处是不需要知晓或假设概率分布
Empirical Confidence Interval 例如对于一个样本数为40的采样,想计算其 95% 置信区间,只需将他们升序排序后取第二个为左边界,倒数第二个为右边界
To calculate a confidence interval empirically. For each experiment, calculate the difference in click-through-probability between the two groups (A/A Testing):
- Calculate the std of the difference and then confidence interval, assuming it’s normally distributed
- Calculate an empirical confidence interval, making no assumptions about the distribution
例如对于一个大的数据集,我们随机采样两个样本数均为40的 Group:
- 逐一相减后计算 difference 的 $\sigma$,$I=[\mu-1.96\sigma,\mu+1.96\sigma]$
- 将 difference 升序排序后取第二个为左边界,倒数第二个为右边界


Document Information
- Author: Zeka Lee
- Link: https://zhekaili.github.io/0010/01/03/AB-Testing-Metrics-for-Experiments/
- Copyright: 自由转载-非商用-非衍生-保持署名(创意共享3.0许可证)
