1. Sanity Checks
1.1 Choose Invariant Metics
When spliting control group and experimental group, there will be some invariants that we should make sure that they are similar in two groups.
For example, ||Changes order of courses in course list
Unit of diversion: user-id| Changes infrastructure to reduce load time
Unit of diversion: event| |-|-|-| |#signed in users|$\checkmark$|$\checkmark$| |#cookies|$\checkmark$ not randomly selected like users, but should be split evenly|$\checkmark$| |#events|$\checkmark$ same as above|$\checkmark$| |CRT on button|$\checkmark$ happens before seeing course list|$\checkmark$ happens before watching videos| |Time to complete course|**not invariant**, will be affected by change| **can't be track** because of event-based diversion
1.2 Check Invariants
For any invariants, we need to check if they are evenly split to each group.
1.2.1 Whether difference within expectation
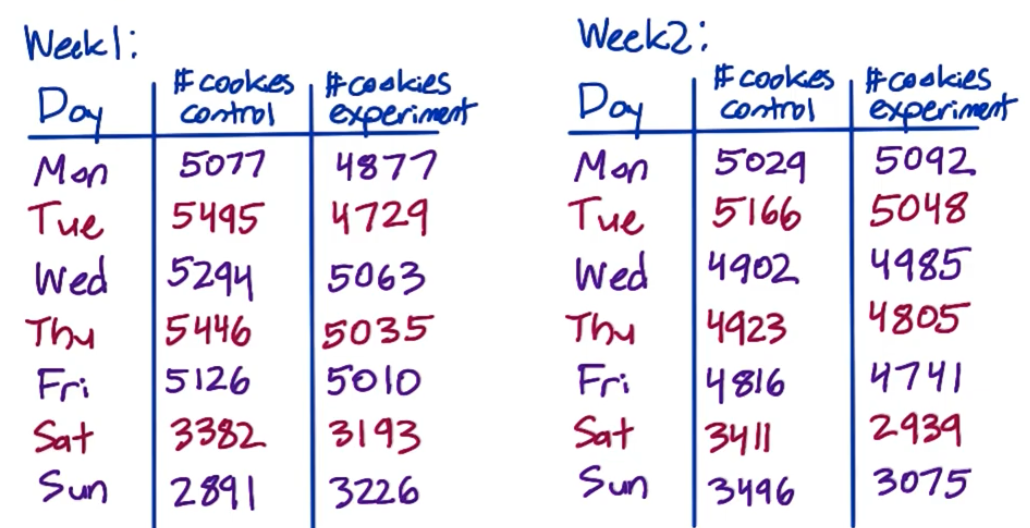
For example, we run an experiment for 2 weeks with an invariant cookie

Total control: 64,454; Total experiment 61,818; Is this difference within expectation?
- Given cookies are randomly assgined, i.e. the probability that assigned to control group is set to $p=0.5$
- Compute std of binomial with $p=0.5$ \(\sigma=\sqrt{\frac{0.5(1-0.5)}{64,454+61,818}}=0.0014\)
- Compute margin of error $m=1.96\sigma$
- Compute confidence interval $0.5\pm m=[0.4973,0.5027]$
- Check if $\hat p$ within interval \(\hat p=\frac{64,454}{64,454+61,818}=0.5104>0.5027\)
Therefore, the difference is without expectation!
1.2.2 When difference without expectation
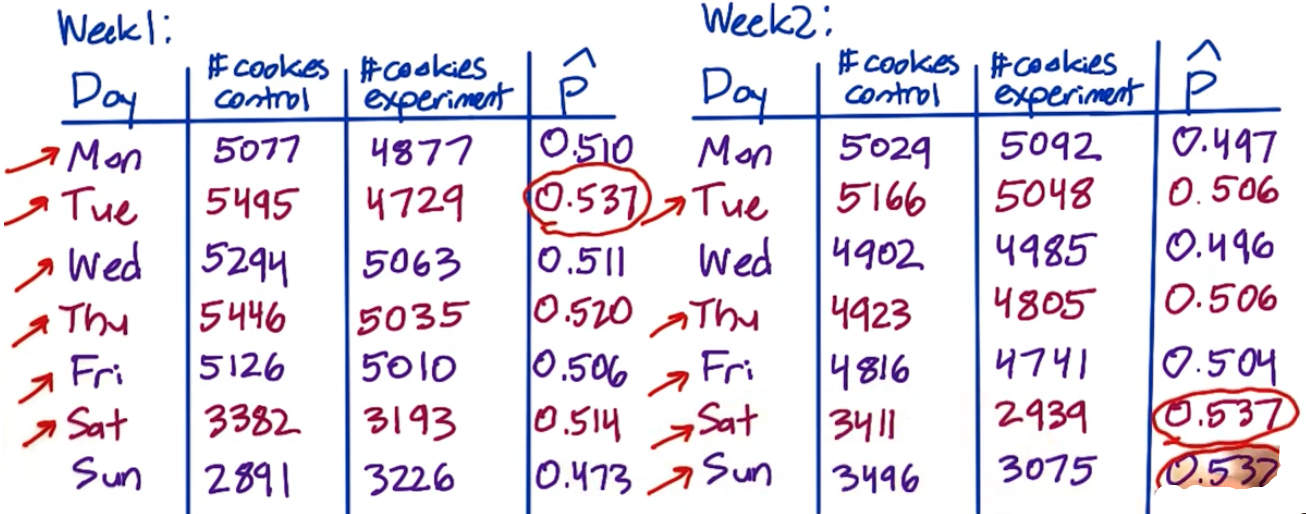
Continous with the above example, when difference is without expectation, we need to check our original data:

(1) If because of outliers
- Red arrows show that in most of days, #cookies control is larger than #cooies experiment
- Red circles show that there are 3 extremely high $\hat p$ over 14 days
- Conclude that it’s an overall problem
(2) What to do
- Talk to the engineer
- Try slicing to see if one particular slice is weird
- Check age of cookies, doe one group have more new cookies
1.3 Gotchas: Simpson’s Paradox
That will happen when we miss to check some smaller groups (invariants)
For example, in the pic below:
- For both new users and experienced users, CTR(click-through-rate) of experiment group > CTR of control group
- However, for total users, CTR of experiment < CTR of control
- That’s because the proportion of new users of exp group and cont group are different

2. Multiple Metrics vs. Single Metric
Compared with single metric, multiple metrics means we care about several metrics at the same time, which will lead to an higher probability of false positive
For example, if $\alpha=0.05$:
- For single metric, the probability that there is not false positive is $P(FP=0)=0.95$
- For multiple metrics, for example 3, $P(FP=0)=0.95^3=0.857$
Pay attention that here we assume 3 metrics are independent (However, in most cases, they are positive correlated, therefore, 0.857 is underestimated)
2.1 Tracking multiple metrics
Problem: Probability of any false positive increases as you increase number of metrics
Solution: Use higer confidence level for each metric
\[\alpha_{overall}=1-(1-\alpha_{individual})^n\]Method 1: Assume independence
where $n$ is the number of chosen metrics. For example, $\alpha_{overall}=0.05,n=5$, then we have $\alpha_{individual}=1-(0.95)^{1/5}=0.01$
\[\alpha_{individual}=\frac{\alpha_{overall}}{n}\]Method 2. Bonferroni correction: Simple and no assumption
**might be too conservative**
\[FDR=E[\frac{\#\text{false positive}}{\#\text{rejections}}]\]Method 3: Control false discovery rate (FDR)
Suppose have 100 metrics with $FDR$ set to be 0.05. This means we’re OK with 5 false positives and 95 true positives in every experiment


4. Gotchas
Document Information
- Author: Zeka Lee
- Link: https://zhekaili.github.io/0010/01/05/AB-Testing-Analyze-Results/
- Copyright: 自由转载-非商用-非衍生-保持署名(创意共享3.0许可证)