1. Data Description
1.1 Middle
- Mean
- Medium: 中位数 $(n+1)/2$
- Mode: 众数
- 可能没有众数: 每个数据都不一样
- 可能有多个众数: [1,2,2,3,3] 中的 2 和 3
1.2 Variability
Range = max - min
Standard deviation \(\sigma=\sqrt{\frac{\sum(x_i-\bar{x})^2}{N-1}}\)
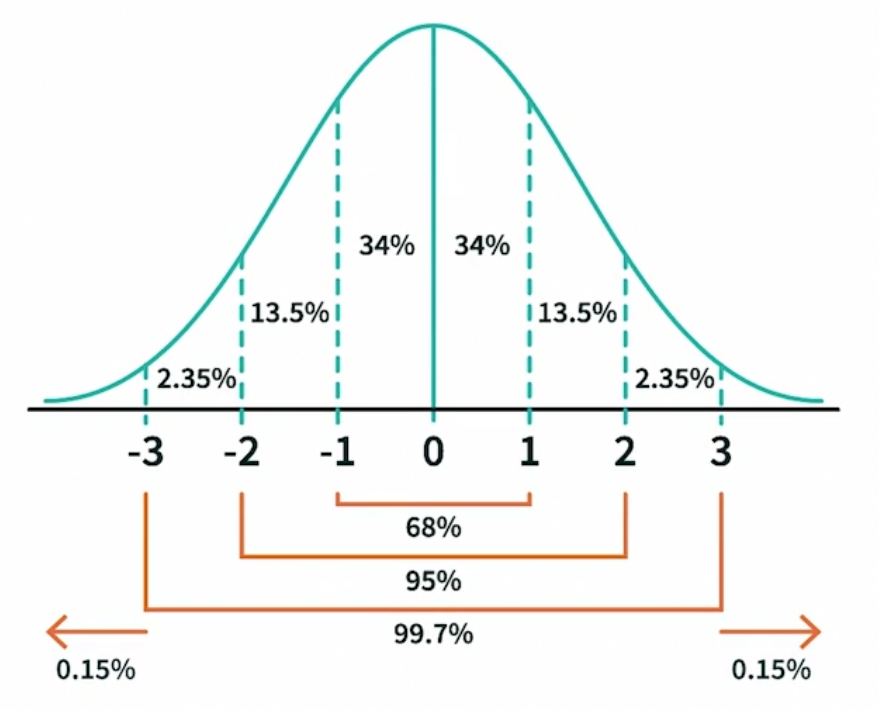
Z-Score: a data point’s distance from the mean (in standard deviation) 是一种显示某个数据偏离程度的标准化的指标 \(\text{z-scrore}=\frac{x_i-\bar{x}}{\sigma}\)
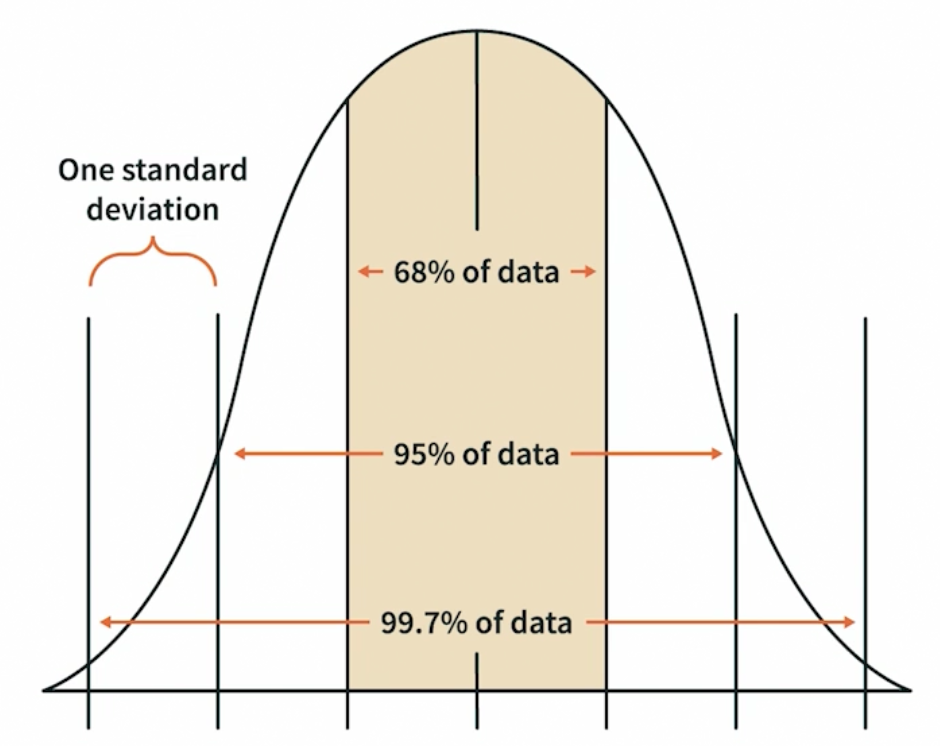
An emperical rule for a bell-shape(normal) distribution, for example:
- Z-score >= 3, we call that an outlier (not among 99.7%)

Outliers Outlier is some data that is faraway from the center. It is not strictly defined (could be more than 1, 2 or 3 sigma, or just 20% larger than mean)
- in some cases, we have to omit outliers to make our model more reasonable
- but in others, outliers might mean something important, like a new trend that used to be omit
2. Probability
2.1 Types of Probability
Classical Probability
- Know all outcomes
- Every outcome is equally likely
- eg. roll a dice, flip a coin
Empirical Proabbaility
- Based on experimental or historical data
- eg. 某个球员投篮命中的概率
Subjective Probability
- Based on personal belief, not statistics
- eg. boss estimate that there’s a 75% for a new project to be launched
2.2 Percentile
- 95th percentile = 5% top
- 50th percentile = median
- 100th percentile = 0% top IMPOSSIBLE!
Calculate percentile \(\%\text{rank}=\frac{\#\text{values below }x+0.5}{\text{total }\#\text{values}}\times 100\)
then round down to an integer
For example, 20 students takes the exam, 2 students get 85, 6 students less than 85, others higher. Calculate the percentile of score 85: \(\frac{6+0.5}{20}=32.5\)
The round down to be 32th percentile
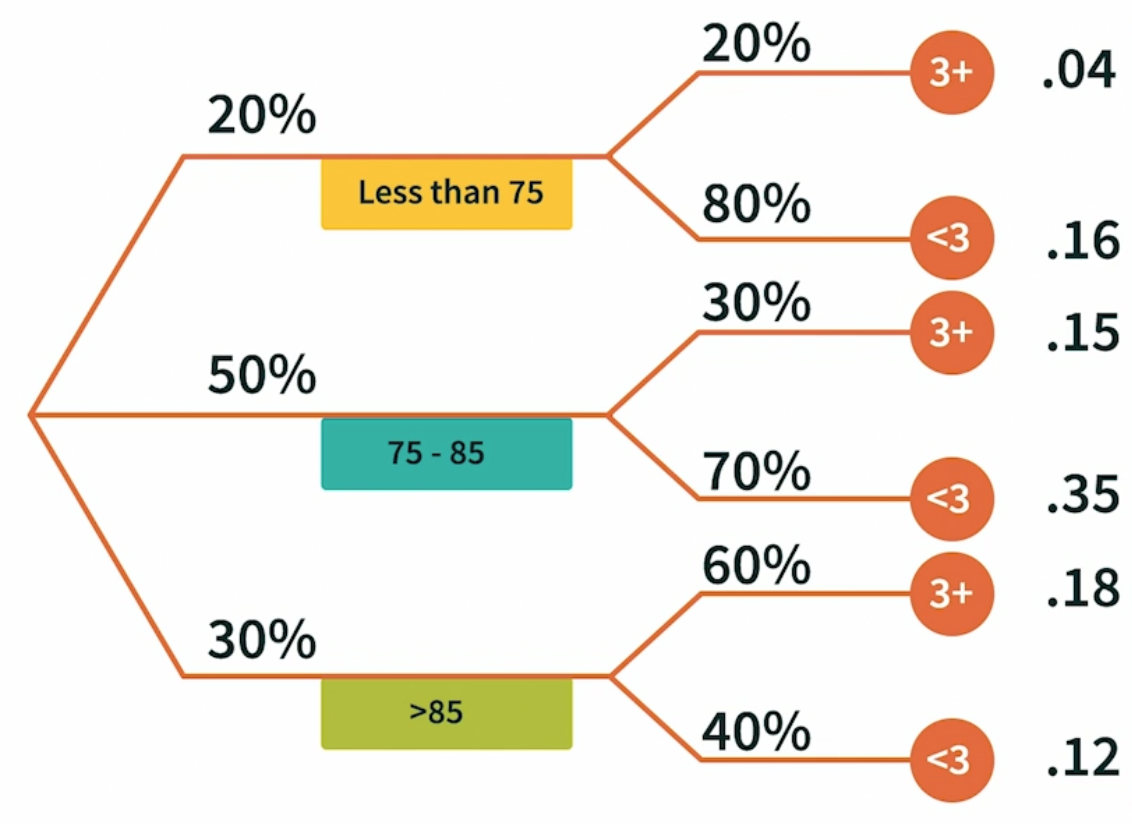
2.3 Probability Trees
A simple but clear tool for multiple event probabilities:
For example, we know the percentage of three groups of different lifespan, and also know the percentage of the people who exercise more than 3 time a week of each lifespan group
Then use probability tree to calculate each detailed group: 
2.4 False Positive
False Positive (假阳性): actually negative but tested positive
False Negative (假阴性): actually positive but tested nagative
3. Sampling
3.1 Simple random sample
Each individual in the population has the same probability of being chosen for inclusion in the sample as any other individual. Two key characteristics:
- unbiased sample
- independant data points (selection of one participant must not influence the selection of other participants)
Simple random sample is the gold stardard
However, simple random sample could be hard to achieve. Examples:
- Phone surveys: Multiple phones, ability to screen calls, time of the call
- Online surveys: Avoidable, easily duplicated, too attractive to one group
3.2 Alternatives to simple random sample
Systematic Sample One unit is chosen and then every $k$ unit thereafter
例如在餐馆门口,对于每五个出来的人,询问其中的第一个人
Opportunity Sample Sampling the first $n$ units that come along
Stratified Sample The total population is broken up into homogenous groups
Cluster Sample Similar to stratified sample, but groups are likely to have a mix of characteristics
3.3 Standard Error
(1) The standard deviation of the proportion distribution $\hat p$
(proportion distribution 指的是例如正确率、得奖率这种比例式的数据)
\[\sigma_{\hat p} = \sqrt{\frac{p(1-p)}{n}}\]For example, for a true value $p=0.9$, we expect that $68\%$ (one sigma) of samples with size $n=25$ to have the $\hat p$ between $[0.9\pm\sqrt{0.9*0.1/25}]$
The larger the $n$ is, the narrower the $68\%$ area will be

\[\sigma_{\bar x}=\frac{\sigma}{\sqrt{n}}\](2) The standard deviation of the sample mean $\bar x$
Mainly used to estimate the population standard deviation $\sigma$ through sample error $\sigma_{\bar x}$


Document Information
- Author: Zeka Lee
- Link: https://zhekaili.github.io/0010/02/01/Statistics-Basis/
- Copyright: 自由转载-非商用-非衍生-保持署名(创意共享3.0许可证)