Key Points
(1) 为方便之后的操作,更建议使用以下代码作为绘图代码的首行 (不要使用 plt.figure())
import matplotlib.pyplot as plt
fig, ax = plt.subplots(figsize=(10, 7))
fig: 画布ax: 绘制对象(重点)
(2) 清空绘图内容(不重复创建画布的同时避免重复绘制)
fig.cla()
1. 基本绘图
1.1 散点图 Scatter
ax.scatter(x=X[:, 0], y=X[:, 1],
    color='red',
    s=10,  # size,即点的大小
    alpha=0.5  # 透明度, 取值区间为 [0, 1]
)
1.2 折线图
ax.plot([x1, x2], [y1, y2],
    '样式',
    linewidth=5,
    label='Name'
)
样式=点形+线形+颜色,例如o-r表示红色圆点实线- 分开表示样式:
linestylemarkercolor
1.3 柱状图 + histogram
ax.bar(labels, heights
    bottom=[0]*len(labels),  # 柱子的起始高度。默认为 0
    width=0.5                # 柱子的宽度
)
柱状统计图(统计数据的分布)
bins: 柱子的个数,默认为10,数量越多画出来的图越精细
plt.hist(X, bins=100)
1.4 画方块
from matplotlib import patches

fig, ax = plt.subplots(figsize=(7, 7))
# 设置坐标轴范围,否则可能因为太小而无法显示画的图
ax.set_xlim(0, 10)
ax.set_ylim(0, 10)

ax.add_patch(
    patches.Rectangle(
        (x, y), # location
        w,      # width
        h,      # height
        color='grey'
    )
)
2. 常用功能
1.1 插入文字
ax.text(x, y, "content", fontsize=10)
示例: 在图中显示各点的坐标
for i_x, i_y in zip(X, Y):
    ax.text(i_x, i_y, '({:.2f}, {:.2f})'.format(i_x, i_y))
1.2 标题 & 图例
ax.set_title("chart name")
ax.plot(..., label="line1")
ax.plot(..., label="line2")
ax.legend()
1.3 坐标轴
# 设置坐标轴名
ax.set_xlabel('X')
ax.set_ylabel('Y')
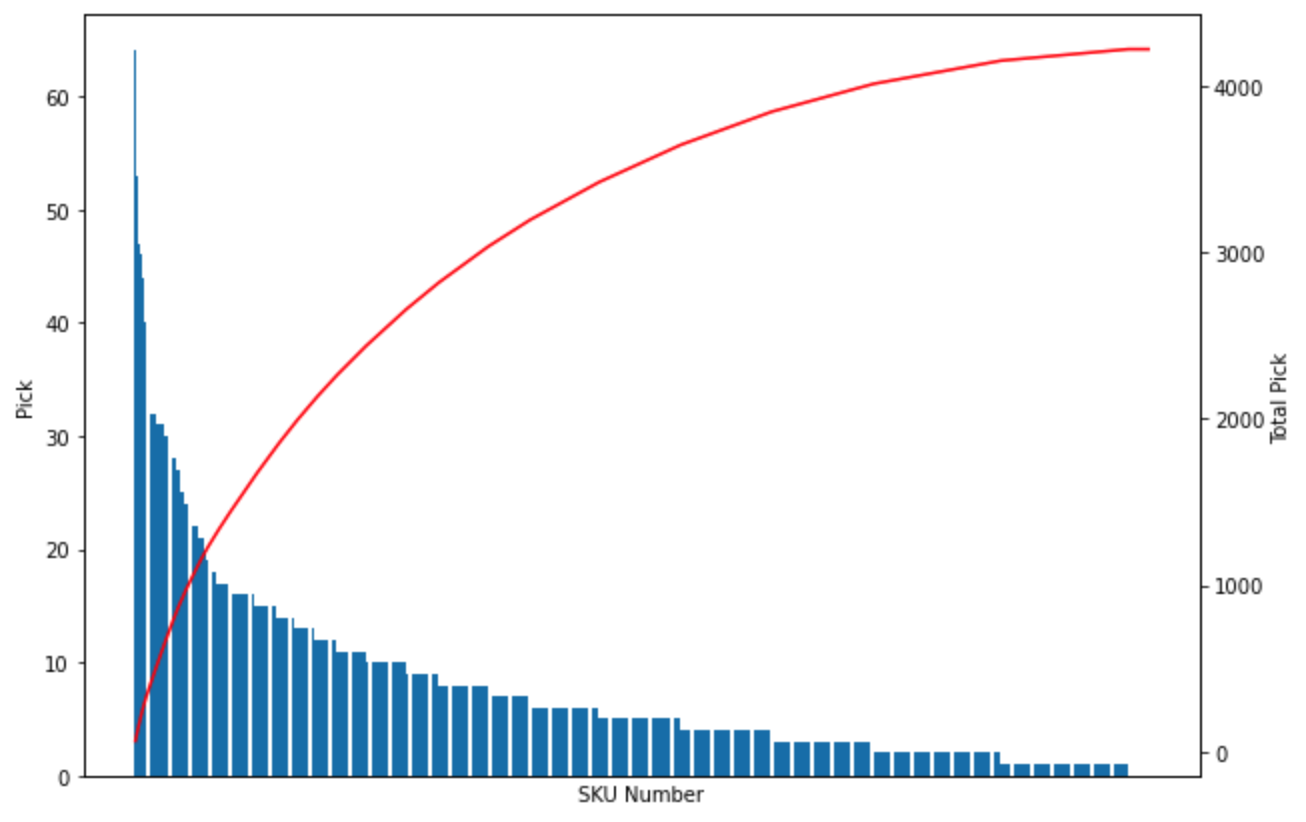
1.3.1 右侧 y 轴
fig, axl = plt.subplots(figsize=(10, 7))
axr = axl.twinx()

axl.bar(...)
axr.plot(...)
1.3.2 坐标轴范围
ax.set_xlim(_min, _max)
当然也可以只设定最大/ 最小值,例如:
ax.set_ylim(ymin=0)
1.3.3 刻度
取消刻度(标签)显示
ax.set_xticks([])
ax.set_yticks([])
设置刻度字体大小
ax.tick_params(labelsize=13)
1.4 网格
ax.grid()
1.5 子图
方法1: 绘制两行三列共六个子图
fig, ax = plt.subplots(2, 3, figsize=(10, 7))
ax[0][0].plot(...)
ax[0][1].scatter(...)
...
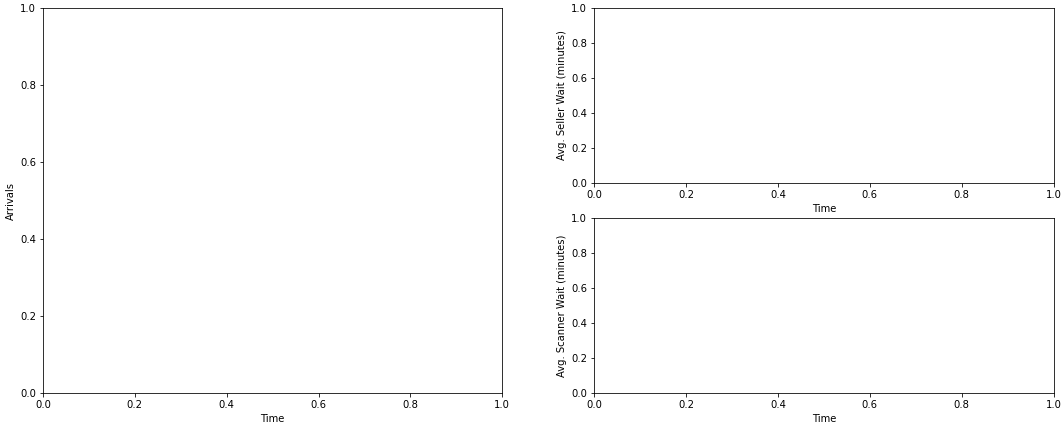
方法2: 绘制大小不同的子图(效果如下) 
f = plt.Figure(figsize=(10, 7))
a1 = f.add_subplot(121) # 把整个画布分成一行二列,当前画在第一个位置(第一行第一列)
a2 = f.add_subplot(222) # 把整个画布分成二行二列,当前画在第二个位置(第一行第二列)
a3 = f.add_subplot(224) # 把整个画布分成二行二列,当前画在第四个位置(第二行第二列)

1.6 输出图片
fig, ax = plt.subplots(figsize=())
fig.savefig('pic1.png')
可选参数
bbox_inches='tight': 缩小输出的图片中可能存在的大面积白色外框
1.7 减小图片页边距
f = plt.Figure(figsize=(14, 4), dpi=72)
# 设置左侧4%的空白比例,右侧10%的空白比例,上方10%的空白比例,下方5%的空白比例
plt.subplots_adjust(left=0.04, right=0.9, top=0.9, bottom=0.05)
f.tight_layout()
Document Information
- Author: Zeka Lee
- Link: https://zhekaili.github.io/wiki/python-libs/python-lib-Matplotlib/
- Copyright: 自由转载-非商用-非衍生-保持署名(创意共享3.0许可证)