1. Overview
A/B testing is a way to compare multiple versions of a single variable, for example by testing a subject’s response to variant A against variant B, and determining which of the variants is more effective
- most A/B tests are run in a fairly short time window
- change one variable in one test (avoid big change in A/B tesing)
Situations that cannot use A/B testing
- website selling cars: will a change increase repeat customers or referrals (long time window)
- online shopping company: is my site complete? (A/B testing is used for compare variants of a single variable, no add)
2. Example: An Education Website
User flow: number of custmers decrease from top to bottom, like a funnel
- Homepage visits
- Explore the site
- Create account
- Complete something (buy a class, share the website….)

Experiment: Change the color of button from orange to pink, to see if there will be more customers explore the site after visting homepage


2.1 Choose a metric
2.1.1 Initial Hypothesis
Changing the “Start Now” button form orange to pink will increase how many students expore the courses provided
2.1.2 Different metrics
After dividing the customers into two groups: group orange vs. group pink, we have to determmine which metric to use.
(1) Total number of courses completed
No.too long time needed to complete courses
(2) Number of clicks
No.the number of customers in group 1 and 2 might differ a lot 
(3) Click-through-rate = #clicks / #page views
Better.eliminate the influence of different number of customers in different groups. However, might be influenced by some meaningless repeated clicks
(4) Click-through-probability = #uique visitors who click / #unique visitors to page
Best.2.1.3 Updated Hypothesis
Changing the “Start Now” button form orange to pink will increase the click-through-probability of the button
2.2 Review Statistics
2.2.1 Estimate Click-through-probability
Let’s say for the initial “orange group” (control group), there are 1000 visitors and 100 unique clicks, so the click-through-probability $\hat p_{cont}=100/1000=0.1$
Then do the same thing for “pink group” (experiment group), and also get a click-through-probability $\hat p_{exp}$, but now, which value of $\hat p_{exp}$ will make us surprise? (how large the $\hat p_{exp}$ should be to make the color change meaningful) 0.11? 0.15? 0.2?
To answer this, we need to find the 95% confidence interval. Since the results of the experiments are click or not click, it’s a typical binomial distribution:
- sample size $N=1000$
- mean $p=\frac{100}{N}=0.1$
- standard error (standard deviation of sample means) $SE=\sqrt\frac{p(1-p)}{N}=0.0095$
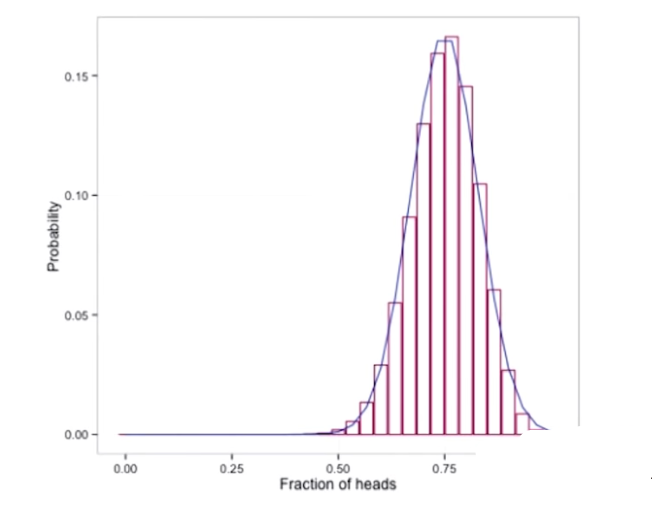
When $N$ is large enough, or both of the equations $N(p)>5$, $N(1-p)>5$ hold, we could consider binomial as normal distribution, and therefore its margin of error: \(m=z^*\times SE\)
its 95% confidence interval: $I = [p-m,p+m]$
- $z^*=1.96$ is the value of 95% confidence interval of the standard normal distribution
- then its 95% confidence interval is $[0.081,0.119]$
Therefore, if the probability of “pink group” > 0.12, it will be considered effective
2.2.2 Hypothesis Testing
假设测试的目的是为了否决零假设 (reject null hypothesis). “零假设” 一般指的是控制组和测试组数据没有差异 (这并不是说完全一样,而是在一个区间之内就算做没有差异)
在这个例子中,如果实验数据不在 “零假设” 的95%置信区间内,即可否决 “零假设”
(1) Null and alternative hypothesis
We have $p_{cont}$ (control group, “orange group”) and $p_{exp}$ (experiment group, “pink group”)
- Null hypothesis $H_0$: $p_{cont}=p_{exp}$
- Alternative hypothesis $H_A$: $p_{cont}\ne p_{exp}$
Steps:
- Measure $\hat p_{cont}$ and $\hat p_{exp}$, define $\hat d=\hat p_{cont}-\hat p_{exp}$
- Calculate $P(\hat d\vert H_0)$
- Reject null if $P<\alpha=0.05$ ($\alpha$ also called p-value)
所以现在的关键是计算 “零假设” 的95%置信区间
(2) Calculate $P(d| H_0)$ via pooled standard error
We have
- $X_{cont}, X_{exp}$: number of unique clicks in two groups
- $N_{cont}, N_{exp}$: number of visitors in two groups
- $\hat p_{cont}, \hat p_{exp}$: click-through-probability
Then define \(\hat p_{pool}=\frac{X_{cont} + X_{exp}}{N_{cont} + N_{exp}}\)
\[\sigma_{pool}=\sqrt{\hat p_{pool}(1-\hat p_{pool})(\frac{1}{N_{cont}}+\frac{1}{N_{exp}})}\] \[\hat d=\hat p_{cont} - \hat p_{exp}\]Define null hypothesis $H_0$: $E[\hat d]=0$ \(\hat d\sim N(0,\sigma_{pool})\)
We reject null if $P<\alpha=0.05$, which means we reject null if $\hat d$ not in the 95% confidence interval of null hypothesis, that is, reject if $\hat d>1.96\sigma_{pool}$ or $\hat d<-1.96\sigma_{pool}$
2.3 Design
2.3.1 Sample Size Matters (Sensitivity)
In previous example, we assume that the sample size $N=1000$, but how we get a that? Could it be 2000 or 5000? It depends on practical or substantive significance
Practical or Substantive Significance: in hypothesis testing, we reject null if $P<\alpha=0.05$, however, even $1\%$ difference could be considered significant, in general, a smaller practical significance needs a larger sample size (size vs. power trade-off)
In this example, we mannual set the practical significance to be $2\%$
Define $\beta$ as the probability that fail to reject when the null hypothesis is false
- $\alpha = P(\text{reject null}\vert\text{null true})$
- $\beta = P(\text{fail to reject}\vert\text{null false})$
- $\text{sensitivity}=1-\beta$
For samll sample size, $N=1000$
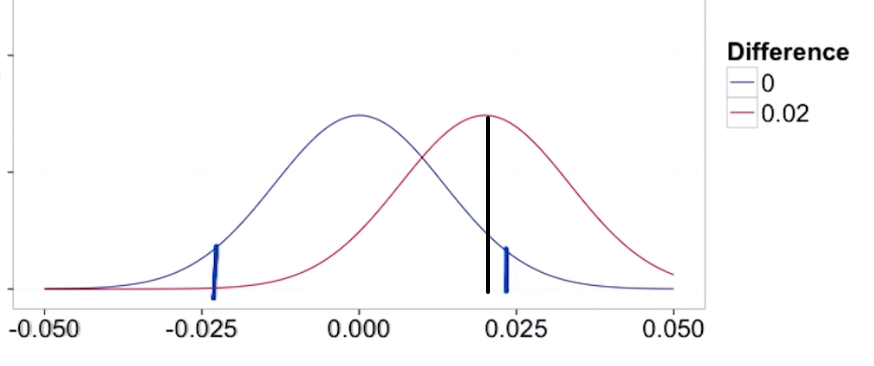
- $\alpha=0.05$ is low
- $\beta$ is high becuase when $\hat d=0.02$, we consider it significant which indicates null fase, but it will not be rejected
- low sensitivity
For large sample size, $N=5000$
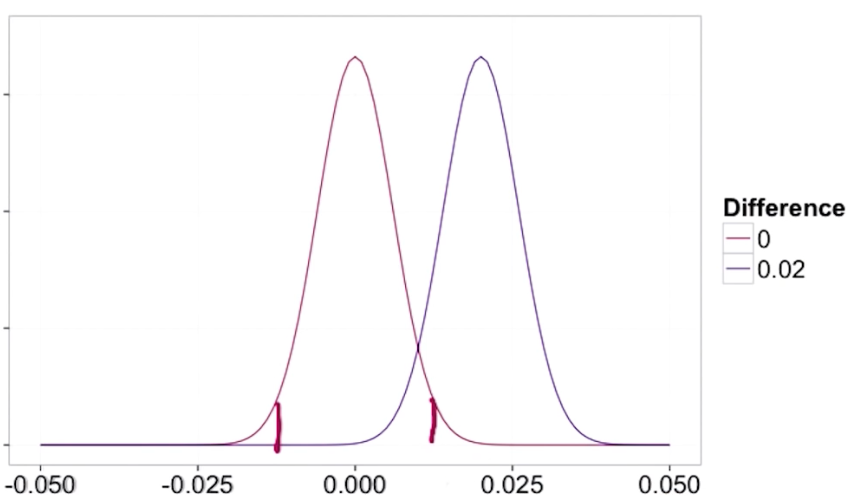
- $\alpha$ same
- $\beta$ is much lower
- high sensitivity
2.3.2 Calculate Sample Size
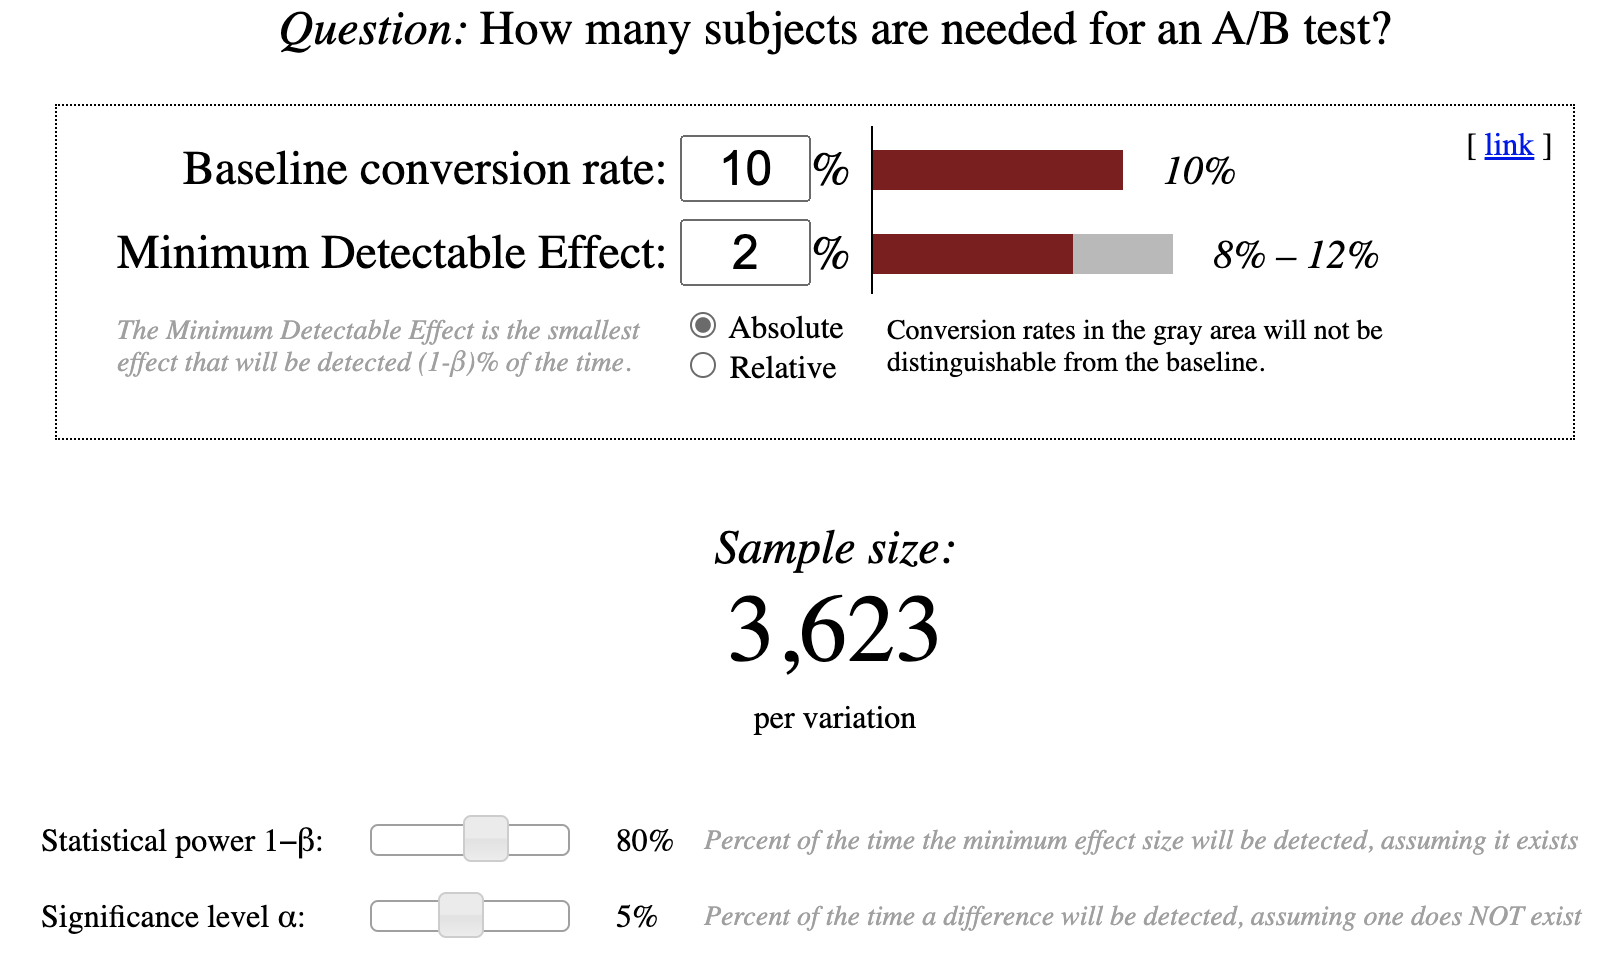
- Baseline conversion rate $=\hat p_{cont}=0.1$
- Miimum Detectable Effect: the practical significance we mannual set = $2\%$
- A large sensitivity set to $1-\beta=80\%$
2.4 Analyze Result
到现在为止,我们已经拒绝了 “零假设”,明确了 minimum sample size 以及 practical significance = $2\%$。最后一步便是判断是否需要 launch the color change
For example, if we have
- $N_{cont}=10072, N_{exp}=9886$
- $X_{cont}=974, X_{exp}=1242$
Then
- $\hat p_{pool}=\frac{X_{cont} + X_{exp}}{N_{cont} + N_{exp}}=0.111$
- $\sigma_{pool}=\sqrt{\hat p_{pool}(1-\hat p_{pool})(\frac{1}{N_{cont}}+\frac{1}{N_{exp}})}=0.00445$
- $\hat d=\hat p_{cont} - \hat p_{exp}=0.0289$
- $I=[\hat d-1.96\sigma_{pool}, \hat d+1.96\sigma_{pool}]=[0.0202,0.0376]$
Since $0.0202>0.02$, we definitely need to change the color from orange to pink
Document Information
- Author: Zhekai Li
- Link: https://zhekaili.github.io/0009/12/31/AB-Testing-Overview/
- Copyright: 自由转载-非商用-非衍生-保持署名(创意共享3.0许可证)